Figures & data
Figure 1. Location of the plots used for investigating the growth of pure and mixed stands of Liaodong oak (Quercus liaotungensis) and Chinese pine (Pinus tabulaeformis) in the Huanglong mountains.
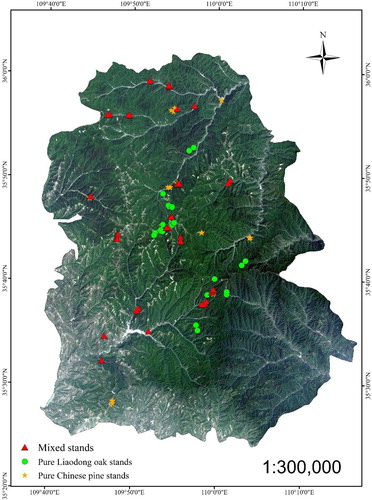
Table 1. Tree characteristics of 120 pure and mixed Liaodong oak (Quercus liaotungensis) and Chinese pine (Pinus tabulaeformis) plots.
Table 2. Stand characteristics of 120 pure and mixed Liaodong oak (Quercus liaotungensis) and Chinese pine (Pinus tabulaeformis) plots.
Table 3. Fixed effect parameter estimates, standard errors, t values, and p-values for the Chinese pine and Liaodong oak growth models (Equation (8)).
Table 4. Goodness of fit statistics for the Chinese pine and Liaodong oak growth models (Equation (8)).
Figure 2. The ratio of different intensities of competition for individuals in pure oak (n = 4572) and pine (n = 4509) forests and pine (n = 5292) and oak (n = 2774) individuals in mixed forests.
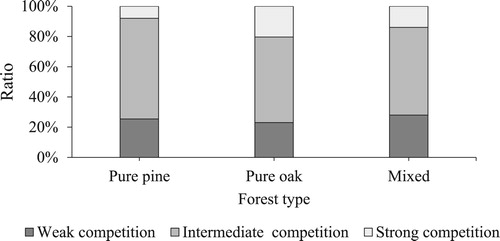
Figure 3. The mean annual increment of tree volume (iv)- tree volume (v) relationship for mixed and pure Liaodong oak and Chinese pine.
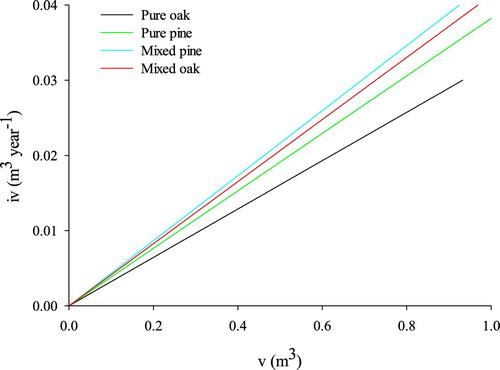
Figure 4. Relationships between the total basal area of trees larger than the subject trees (BAL) and mean annual increment of tree volume (iv) of Chinese pine and Liaodong oak.
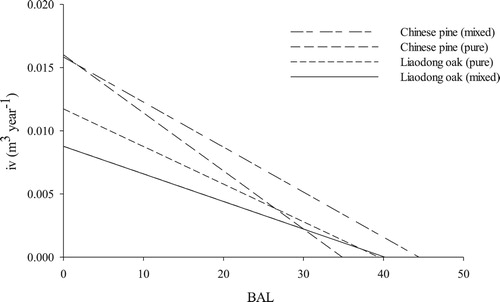
Figure 5. Diameter at breast height (DBH) classes of pure and mixed Chinese pine and Liaodong oak plots.
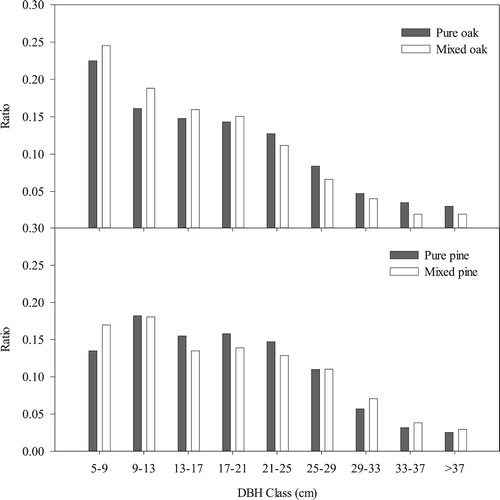
Figure 6. Influence of mixing on the periodic annual volume increment (PAIV) of different diameter at breast height (DBH) classes of Chinese pine and Liaodong oak.
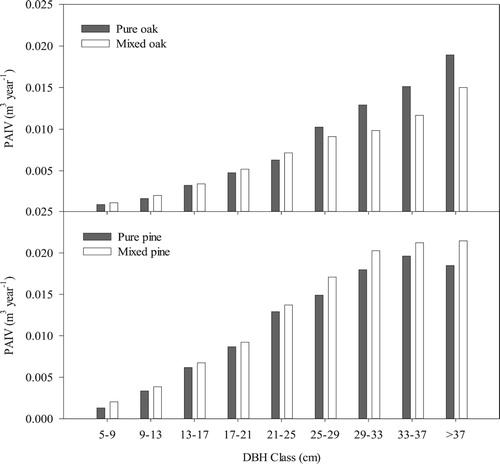
Figure 7. Modeled stand volume increment (PAIV) of pure and mixed stands of Chinese pine and Liaodong oak with different stand density indices (SDI) and site forms (SF).
Note: The dg of pine and oak in this figure are 20 cm.
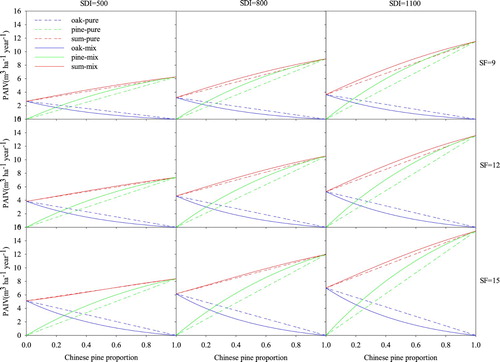
Figure 8. Response of relative mixing response (RMR) to total stand density index (SDI) and site form (SF) at a ratio of 50% Chinese pine.
Note: The dg of pine and oak in this figure are 20 cm.
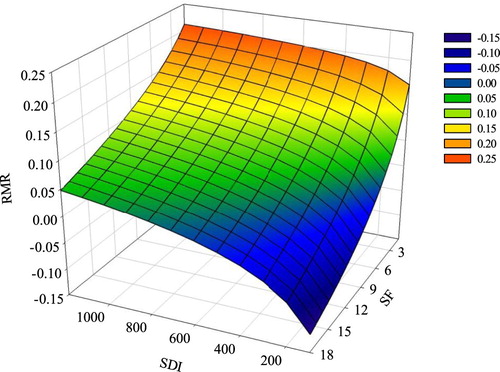
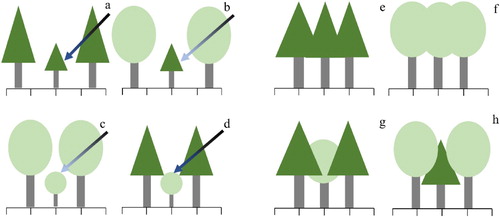
Figure 9. The effect of mixing pine (triangle crown) and oak (oval crown) trees (b, d, g, h) on canopy space and the availability of light (blue arrow) of different intensities (a darker arrow color indicates a higher intensity of light) compared with pure pine (a, e) and oak (c, f) stands.