Figures & data
Figure 1. The change in F. graminearum-induced FRR necrosis after application of defence-related hormones 100 µM SA (A), 1 µM JA (B), 100 µM ACC (C), and 9 mM BABA (D) on Bd3-1 seedling roots. Four-day-old roots were inoculated 6 h after transfer to hormone-amended medium. Each data point is the mean root necrosis length ± SE from two (A, B, C) or three (D) independent experiments, except score date 3 from C which was from one independent experiment. Score Date numbers (3-day intervals between each number) for B and C are the combined dpi from different experiments. Significance levels: ** p < .01, *** p < .001 compared to control.
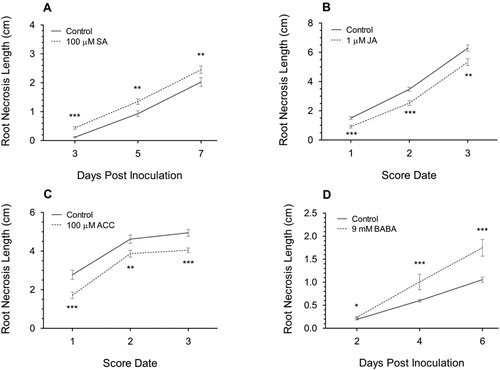
Figure 2. The change in F. graminearum-induced FRR necrosis after application of development-related auxins 10 µM IAA (A) and 5 µM NAA (B), and the cytokinins 10 µM trans-Zeatin (C) and 10 µM kinetin (D) on Bd3-1 seedling roots. Four-day-old roots were inoculated 6 h after transfer to hormone-amended medium. Each data point is the mean root necrosis length ± SE from three (C), two (A and B) or one (D) independent experiments. Significance level ** p < .01, *** p < .001 compared to control. Visual difference for A in Supp. S2 and C in Supp. S3.
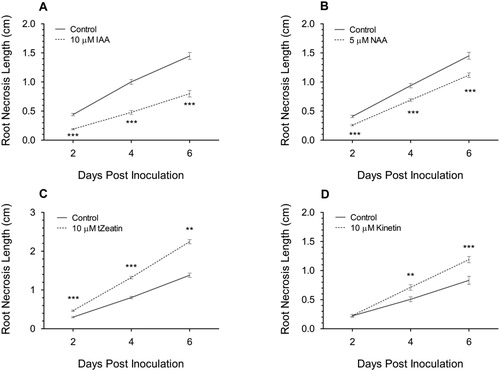
Figure 3. The change in number of F. graminearum-infected florets after pre-application of 200 µM SA (A), 50 µM JA (B), 1 mM ACC (C), 10 mM BABA, (D) and 10 µM trans-Zeatin (E) on Bd3-1. Each data point is the mean number of florets infected ± SE from one (A), two (B, C, E) or three (D) independent experiments. Score Date numbers (4-day intervals between each number) for B and D are the combined dpi from different experiments. Significance levels: * p < .05, ** p < .01, *** p < .001 compared to control.
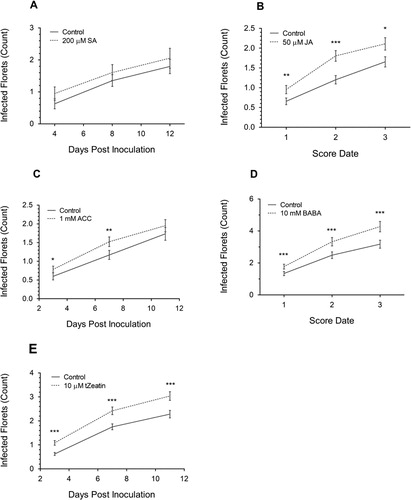
Figure 4. The number of F. graminearum-infected florets at 8 dpi after pre-application of IAA or NAA on Bd21. Each bar is the mean number of florets infected ± SE from one experimental replicate. Significance levels: ** p < .01, *** p < .001 compared to control.
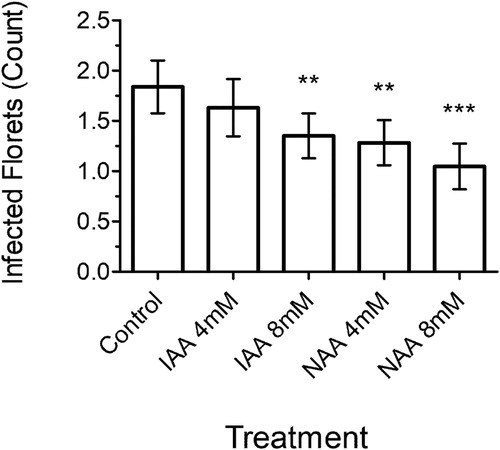
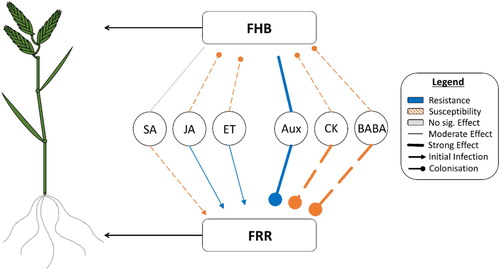
Figure 5. Model summarizing all exogenous hormone application experiments (–). Compares the effects between FHB and FRR in B. distachyon (on the left). This summary is a generalization of the trend over time and includes different arrow thicknesses based on the potency of response caused by each phytohormone. Includes the predicted slope regression groups for each phytohormone presented as different arrow caps (excluding auxins and SA as these were not measured or not significantly different to control). Novel abbreviations: ET (ethylene), Aux (auxins), CK (cytokinins).