Figures & data
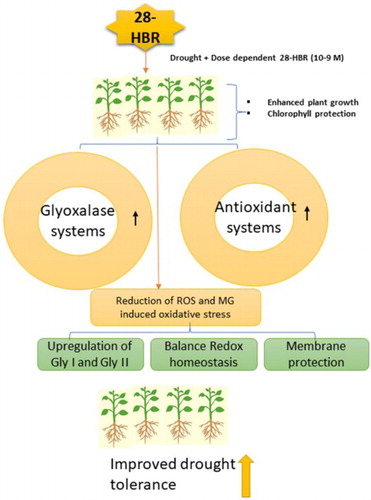
Figure 1. Effect of HBR on shoot length (A), fresh weight (B), and dry weight (C) of soybean seedlings under drought stress. Data presented are mean (±SE) of three replicates, and bars with dissimilar letters are significantly different at the P ≤ 0.05 level.
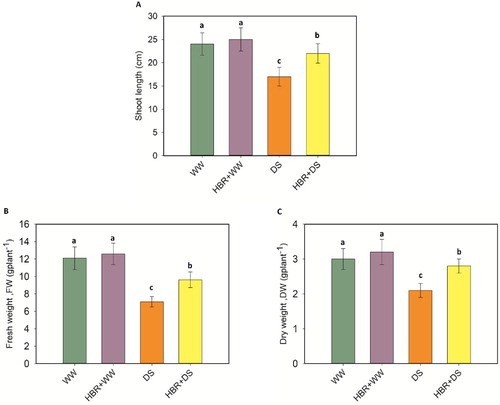
Figure 2. Effect of HBR on photosynthetic pigments (A) and chlorophyll fluorescence (B) in the leaf of soybean seedlings under drought stress. Data presented are mean (±SE) of three replicates, and bars with dissimilar letters are significantly different at the P ≤ 0.05 level.
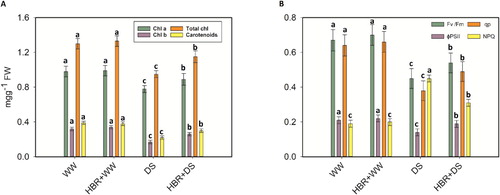
Figure 3. Effect of HBR on CO2 assimilation rate (A), and stomatal conductance (B) in leaf of soybean seedlings under drought stress. Data presented are mean (±SE) of three replicates, and bars with dissimilar letters are significantly different at the P ≤ 0.05 level.
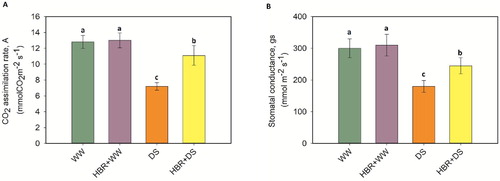
Figure 4. Heat map showing the effects of HBR macro element contents (N, P, K Ca, Mg) in the shoot (A) and root (B) of soybean seedlings under different treatments (WW, HBR +WW, DS, HBR +DS). Logarithmic transformation (log10) values shown in color scale (higher levels are displayed in dark blue, lower levels in pink and intermediate levels in yellow colors).
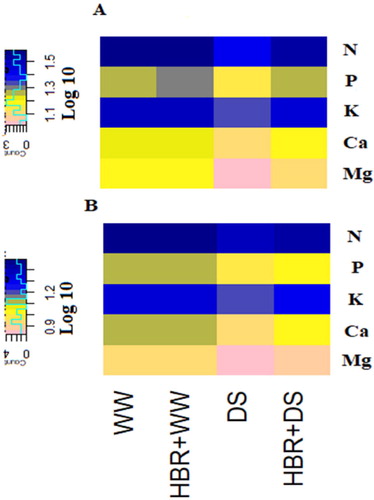
Figure 5. Effect of HBR on proline content (A), glycine betaine (B), total phenolic content (C), total flavonoid content (D), Anthocyanins (E), and Root activity (F) in the leaf of soybean seedlings under drought stress. Data presented are mean (±SE) of three replicates, and bars with dissimilar letters are significantly different at the P ≤ 0.05 level.
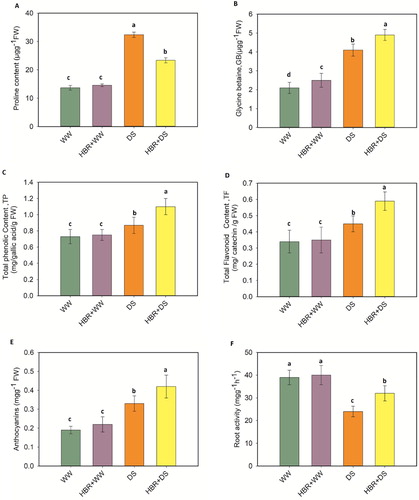
Figure 6. Exogenous application of HBR on H2O2 content (A), lipid peroxidation (MDA content) (B), Electrolyte leakage (C), superoxide anions (D), LOX activity (E), and Thiobarbituric acid reactive substances, TBARS (F) in leaf of soybean seedlings under drought stress. Data presented are mean (±SE) of three replicates, and bars with dissimilar letters are significantly different at the P ≤ 0.05 level.
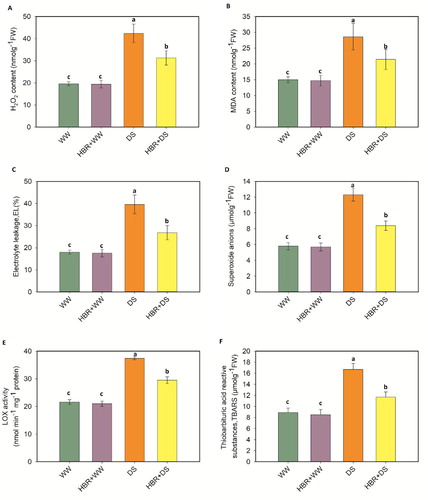
Figure 7. Exogenous application of HBR on SOD activity (A), CAT activity (B), APX activity (C), GR activity (D), DHAR activity (E), and MDHAR activity (F) in the leaf of soybean seedlings under drought stress. Data presented are mean (±SE) of three replicates, and bars with dissimilar letters are significantly different at the P ≤ 0.05 level.
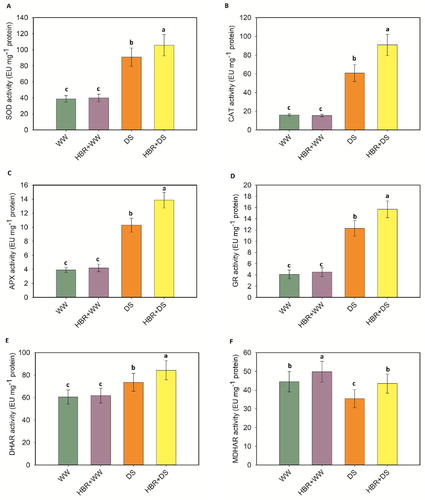
Figure 8. Effect of HBR on AsA content (A), DHA content (B), GSH content (C), GSSG content (D), GST activity (E), and GPX activity (F) in the leaf of soybean seedlings under drought stress. Data presented are mean (±SE) of three replicates, and bars with dissimilar letters are significantly different at the P ≤ 0.05 level.
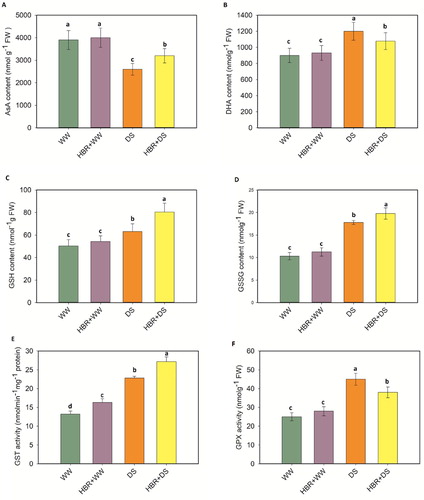
Figure 9. Effect of HBR on MG content (A), GLY I activity (B), and GLY II activity (C) in the leaf of soybean seedlings under drought stress. Data presented are mean (±SE) of three replicates, and bars with dissimilar letters are significantly different at the P ≤ 0.05 level.
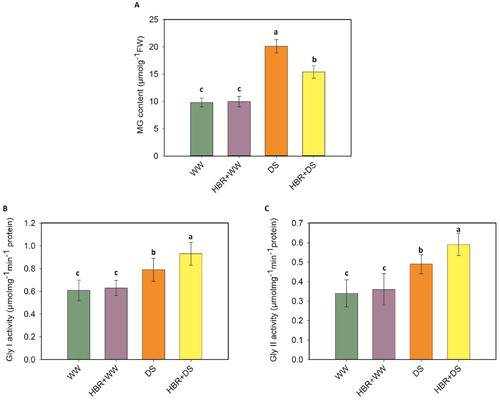
Figure 10. The Heatmap and PCA display the variable-treatment relationships. In Heatmap, logarithmic transformation (log10) values shown in color scale (lower values to higher values revealed as red to green). All dataset was performed using PCA. The variables include shoot length, FW,DW, Chl a, Chl b, carotenoid, qp, Fv/Fm, ɸPSII, NPQ, N, P, K Ca, Mg content, proline content, glycine betaine (GB),total flavonoid content (TF), total phenolic contents (TP), H2O2 content, malondialdehyde (MDA),Electrolyte leakage (EL), LOX activity, Anthocyanins, Root activity, SOD activity, CAT activity, APX activity, GR activity, DHAR activity, and MDHAR activity, and Thiobarbituric acid reactive substances, TBARS (F), AsA content, DHA content, GSH content, GSSG content, GST activity,GPX activity, MG content, GLY I activity, and GLY II activity.
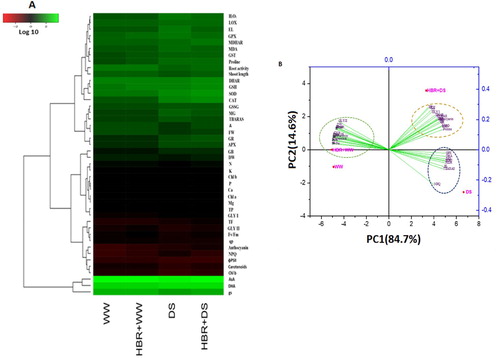
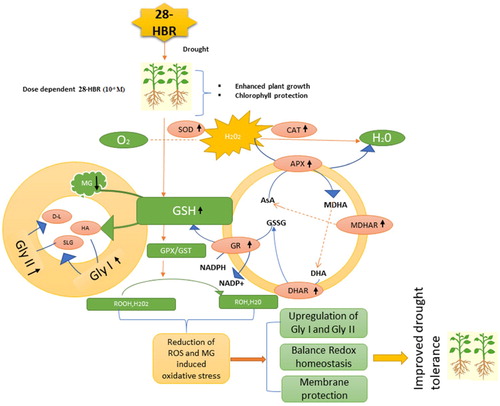
Figure 11. A proposed model is showing how HBR mitigates drought stress in soybean seedlings.