Figures & data
Figure 1 Comparative phenotypic response of Kitaake rice seedlings to Hessian fly larval feeding. (a) Representative plants of Kitaake rice plants showing resistance response having first-instar larvae at the base of the crown tissue (the larval feeding site); resistant host wheat Iris showing dead first-instar larvae; and susceptible host wheat Newton showing larvae at the second-instar (white) and third-instar developmental stage at 5, 7, and 12 DAH time points. (b) Nonhost Bd (Brachypodium distachyon), where most larvae are dead first-instars, however, there are some larvae that have developed into second-instars at 9 and 36 DAH, but the larvae are much smaller in size as compared to virulent larvae feeding on susceptible host wheat, at 7 DAH.
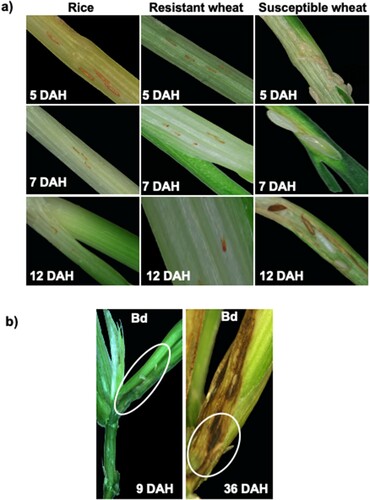
Figure 2 Leaf and plant growth in Hessian fly-infested Kitaake rice seedlings. (a) Nondestructive leaf (L1: leaf 1; L2: leaf 2; L3: leaf 3; L4: leaf 4) length measurements were taken in Biotype L-infested and uninfested Kitaake rice seedlings at 9 DAH. Measurements were taken from soil level to the tips of the leaf blades. Data are represented as means from 23 biological replicates. Error bars represent the standard error of the mean. Letters at the top of bars indicate significant differences determined using Tukey’s HSD test (p < .05). Same letters indicate no difference in lengths.
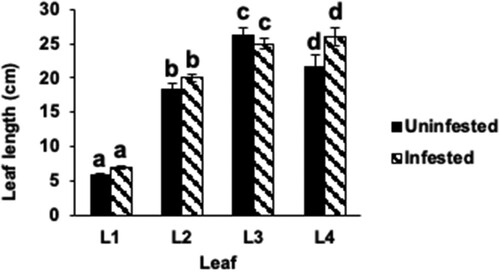
Figure 3. Changes in plant cell wall permeability in Kitaake rice seedlings. Permeability was determined by neutral red (NR) staining. Representative uninfested control rice plant was pin-pricked and stained to differentiate staining caused by physical damage and larval feeding. Representative NR stained Hessian fly-infested rice seedlings at 1, 4, and 9 DAH time points show NR staining as blush and solid lines that are restricted at the larval feeding site. Scores for the staining are given below the images as means of staining scores from 7 biological replicates ± standard error of mean.
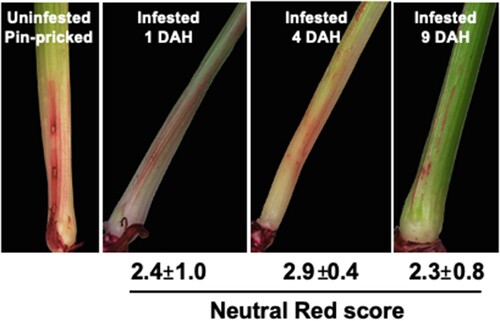
Figure 4 Expression of Hessian fly-responsive biomarker genes in Kitaake rice seedlings in response to Hessian fly larval feeding. Transcript levels of (a) OsHfr-1 (Hessian fly response gene 1), (b) OsHfr-3 (Hessian fly response gene 3), (c) OsHfrDrd (Hessian fly responsive disease resistance dirigent-like protein), (d) OsMds-1 (Mayetiola destructor susceptibility gene 1), (e) OsOdc (ornithine decarboxylase), and (f) OsLtp1 (lipid transfer protein 1) were quantified by qRT-PCR in Hessian fly-infested and uninfested Kitaake rice seedlings at 1, 3, 5, and 9 DAH time points. Values are plotted as the log2 fold change of infested compared to uninfested control plants with standard error bars for three biological replicates. Asterix (*) above each bar indicates statistically significant differences (p < .05). Linear fold change values are also indicated above each bar.
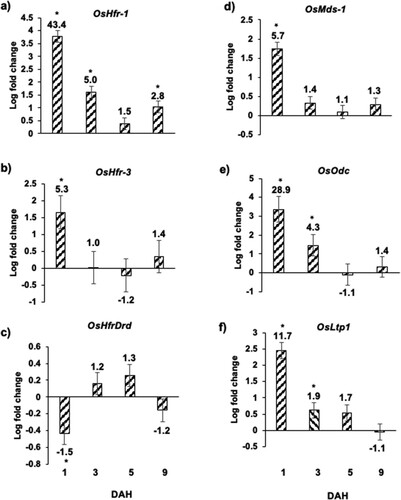
Figure 5 Expression of cell wall-associated proteins in Kitaake rice seedlings in response to Hessian fly larval feeding. Heatmap depicting the ratio of transcript levels quantified by qRT-PCR in Hessian fly-infested and uninfested Kitaake rice seedlings at 1, 3, 5, and 9 DAH time points. Blue and red represent up-regulated and down-regulated genes, respectively. Values shown within each cell is the mean fold change of infested compared to uninfested control plants for three biological replicates. Asterix (*) within a cell indicates statistically significant difference (p < .05). OsCesA (cellulose synthase), OsSuSy (sucrose synthase), OsCOBRA (glycosyl-phosphatidyl inositol-anchored protein), OsPe (pectin esterase), OsPae (pectin acetyl esterase), OsExp (expansin), Osβ-glu (beta-glucosidase), Osα-gal (alpha-galactosidase), OsXth (xyloglucan endotransglucosylase/hydrolase), OsXyl (xylanase), OsEg (endoglucanase), OsAgp (arabinogalactan protein), OsPg (polygalactouronase), and OsWak (wall-associated kinase).
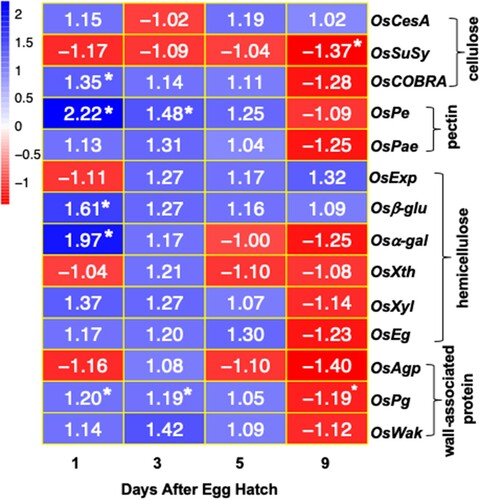
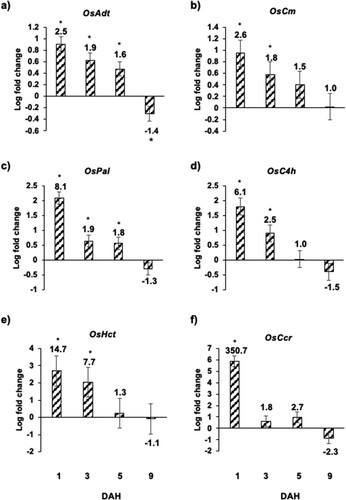
Figure 6 Expression of genes involved in biosynthesis of phenylpropanoids and lignins in Kitaake rice seedlings in response to Hessian fly larval feeding. Transcript levels of (a) OsAdt (arogenate dehydratase), (b) OsCm (chorismate mutase), (c) OsPal (phenylalanine-ammonia lyase), (d) OsC4 h (cinnamate 4-hydroxylase), (e) OsHct (hydroxycinnamoyl-CoA shikimate/quinate hydroxycinnamoyl transferase, and (f) OsCcr (cinnamoyl CoA reductase) were quantified by qRT-PCR in uninfested and Hessian fly-infested Kitaake rice seedlings at 1, 3, 5, and 9 DAH time points. Values are plotted as the log2 fold change of infested compared to uninfested control plants with standard error bars for three biological replicates. Asterix (*) above each bar indicates statistically significant differences (p < .05). Linear fold change values are also indicated above each bar.