Figures & data
Figure 1. Plant materials of Ananas comosus var. bracteatus used in this study, (A) the base part of the tissue culture shoots used for callus induction, (B) callus with small shoots, and (C) shoot used for the experiment.
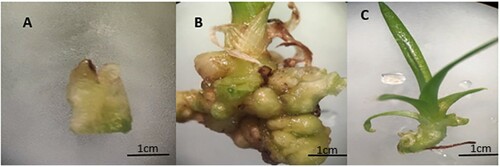
Table 1. List of miRNA used in the research.
Figure 2. Effects of MgO NPs on the growth and development of Ananas comosus var. bracteatus. Different letters denote statistical significance within p-value <.05.
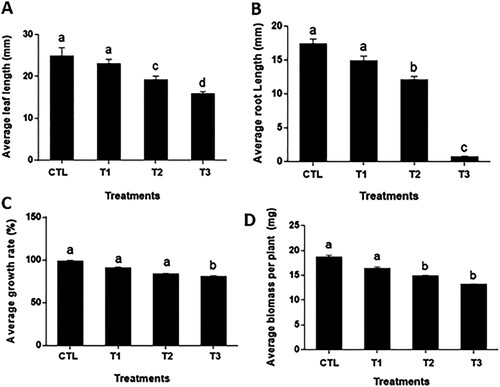
Figure 3. Effects of MgO NPs on the growth and development of Ananas comosus var. bracteatus. (A) Effect of the different MgO NPs concentrations on the chlorophyll content of leaves. (B) The phenotype of var. bracteatus plants with MgO NPs treatments. Error bars represent the standard deviation.
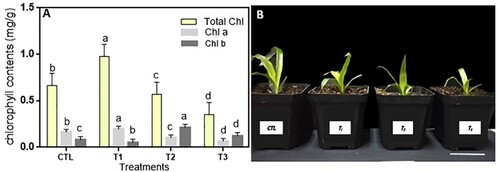
Figure 4. Microscopic observation images (cross-sections) of the Ananas comosus var. bracteatus leaves (A, B), stems (CD), and root (EF) exposed to 4 g/mL (T3) (BDF) of MgONPs and Control (ACE). Scale bar ABCD=100 μm, EF = 50 μm.
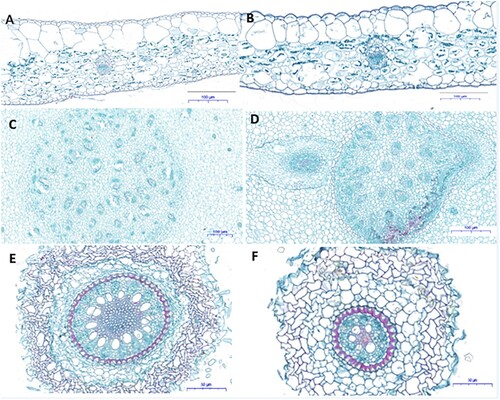
Figure 5. Microscope detection of the accumulation of MgO NP in the leaf, stem, and root of Ananas comosus var. bracteatus. Leaves, stem, and root of control plants (ACE) and var. bracteatus under 4 g/mL MgO NP for six weeks (BDF). Bar: 100 μm.
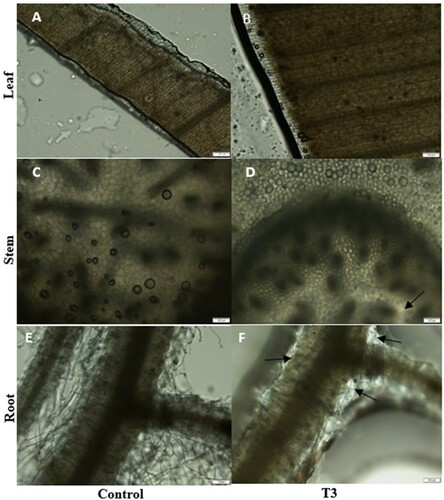
Figure 6. Average fold changes in expression of stress, root hair and cell wall related genes in Ananas comosus var. bracteatus plants exposed to MgO NPs. Error bars represent standard errors.
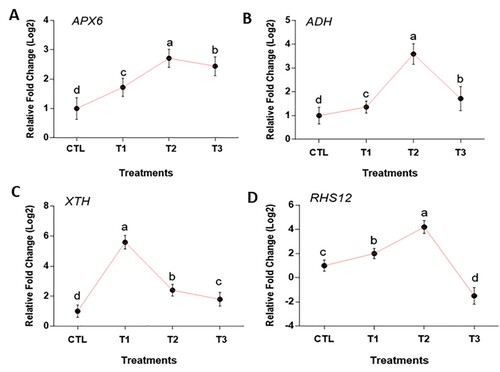
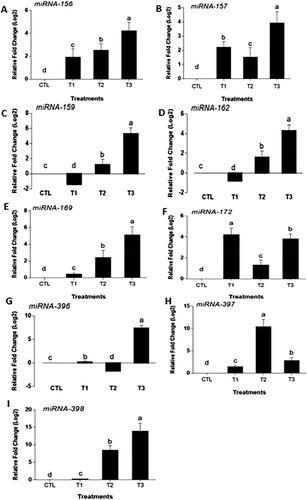
Figure 7. Average miRNAs fold changes in expression in Ananas comosus var. bracteatus response to MgO NPs treatments (0/CTL, 1 g/mL/T1, 2 g/mL/T2, and 4 g/mL/T3). Values are mean of replicates with SD. Statistical significance is denoted by letters a–d. Changed in the letters denote statistical significance.