Figures & data
Figure 1. Effects of WV on phenotype (a), Chl a content (b), Chl b content (c), Chl a/b (d), Chl a + b content (e), Car content (f) and Car/Chl a + b (g) of tobacco leaves infected by Pst. Note: The data in the figure are from three biological repeats (n = 3), and represent means ± standard error (SE). Significant differences were expressed by different letters (P < 0.05).
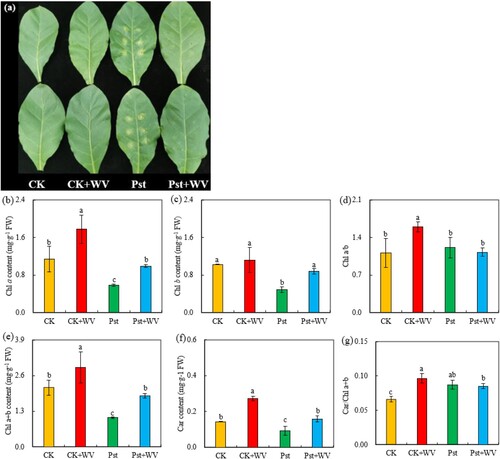
Figure 2. Effects of WV on the OJIP curve (a), MR820 curve (b), Fv/Fm (c), PIABS (d), and ΔI/Io (e) of tobacco leaves infected by Pst. Note: The data in the figure are from three biological repeats (n = 3), and represent means ± standard error (SE). Significant differences were expressed by different letters (P < 0.05).
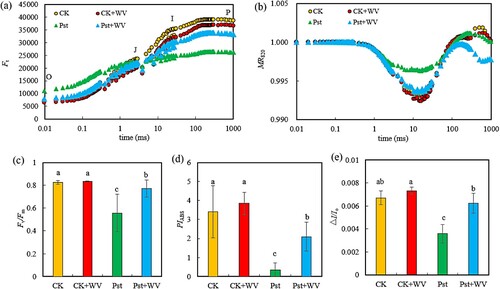
Figure 3. Effects of WV on the VO-P (a), ΔVO-P (b), VO-J (c), ΔVO-J (d), VO-K (e), ΔVO-K (f), VJ (g), VK (h) and VL (i) of tobacco leaves infected by Pst. Note: The data in the figure are from three biological repeats (n = 3), and represent means ± standard error (SE). Significant differences were expressed by different letters (P < 0.05).
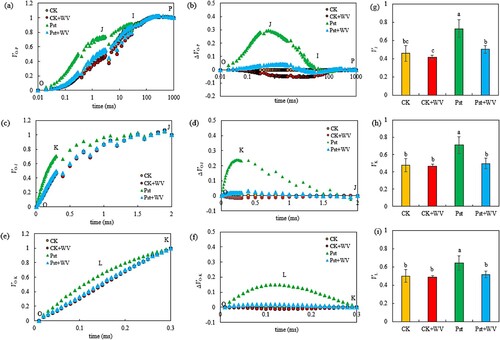
Figure 4. Effects of WV on the light energy absorption and utilization parameters of tobacco leaves infected by Pst. Note: The data in the figure are from three biological repeats (n = 3), and represent means ± standard error (SE). Significant differences were expressed by different letters (P < 0.05).
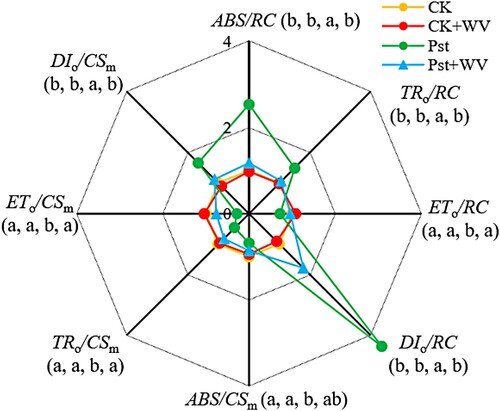
Figure 5. Effects of WV on the generation rate of (a), H2O2 content (b), CAT activities (c), SOD activities (d), POD activities (e), APX activities (f) and GPX activities (g) of tobacco leaves infected by Pst. Note: The data in the figure are from three biological repeats (n = 3), and represent means ± standard error (SE). Significant differences were expressed by different letters (P < 0.05).
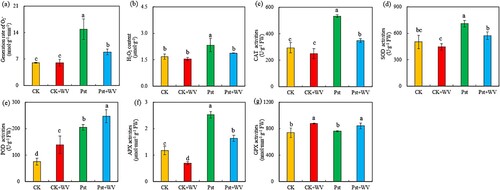
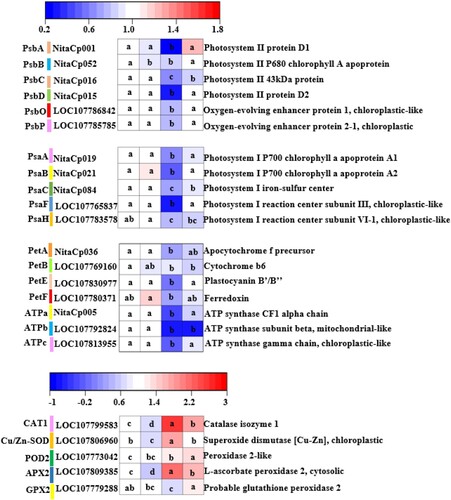
Figure 6. Effects of WV on the key gene expression of photosynthetic and antioxidant enzymes of tobacco leaves infected by Pst. Note: The data in the figure are from three biological repeats (n = 3), and represent means ± standard error (SE). Significant differences were expressed by different letters (P < 0.05).