Figures & data
Figure 1 . Differentially expressed genes (DEGs) in Theobroma grandiflorum challenged with Moniliophthora perniciosa. A) Heatmap of 440 DEGs from intra-genotype analysis. The color scale presents unit variance, with down- and upregulated genes under different conditions indicated in blue and red, respectively. B) Venn diagram of DEGs (intra-genotype analysis). C and D) DEGs at 24 and 48 HAI, respectively, discriminating up- and down-regulated genes. E) Heatmap of 301 DEGs from inter-genotypes analysis. Genes with higher expression levels in the susceptible genotype are indicated in blue, while those with higher expression levels in the resistant genotype are indicated in red. F) Venn diagram of DEGs (inter-genotypes analysis). R = resistant, S = susceptible, RT and ST = non-inoculated controls, R24 and S24 = 24 HAI, R48 and S48 = 48 HAI.
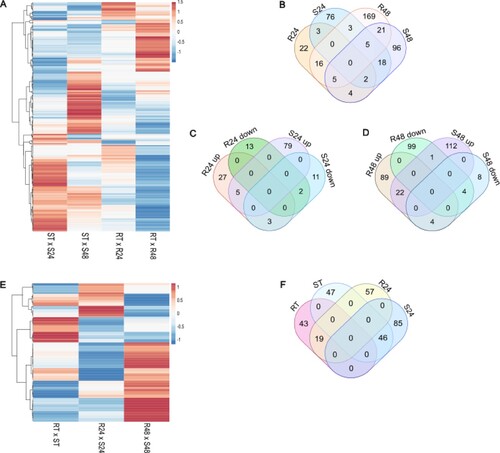
Figure 2 . Differential expression profiles of pattern-recognition receptors (PRRs) genes during Theobroma grandiflorum–Moniliophthora perniciosa interaction. A) Heatmap of variation in PRRs expression in intra-genotype analysis. The color scale presents unit variance, with down- and upregulated genes under different conditions indicated in blue and red, respectively. B) Heatmap of variation in PRRs expression in inter-genotypes analysis. Gene with higher expression levels in SG are indicated in blue, while those with higher expression levels in RG are indicated in red. R = resistant, S = susceptible, RT and ST = non-inoculated controls, R24 and S24 = 24 HAI, R48 and S48 = 48 HAI.
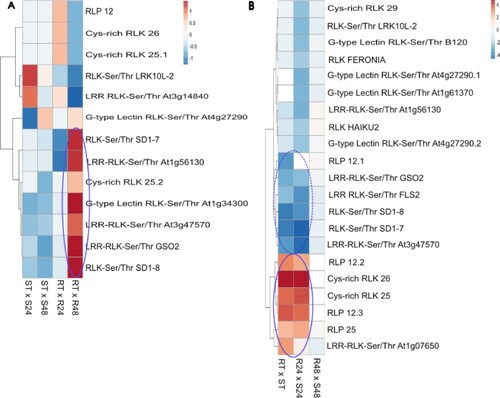
Figure 3 . Differential expression profile of transcription factors (TFs) during Theobroma grandiflorum–Moniliophthora perniciosa interaction. A) Heatmap of variation in TFs expression in intra-genotype analysis. The color scale presents unit variance, with down- and upregulated genes under different conditions indicated in blue and red, respectively. B) Heatmap of variation in TFs expression in inter-genotypes analysis. Genes with higher expression levels in SG are indicated in blue, while those with higher expression levels in RG are indicated in red. R = resistant, S = susceptible, RT and ST = non-inoculated controls, R24 and S24 = 24 HAI, R48 and S48 = 48 HAI.
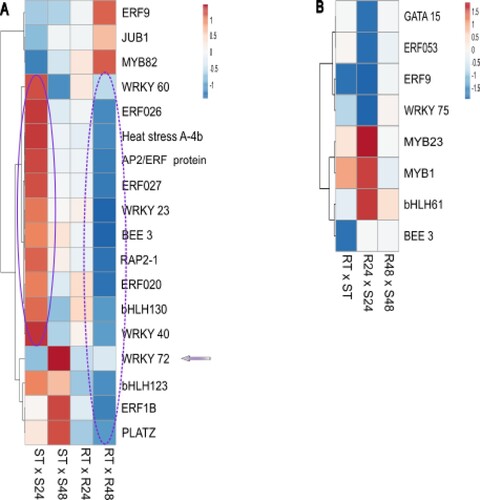
Figure 4 . Differential expression profile of pathogenesis related (PR) genes in Theobroma grandiflorum–Moniliophthora perniciosa interaction. A) Heatmap of variation in PRs expression in intra-genotype analysis. The color scale presents unit variance, with down- and upregulated genes under different conditions indicated in blue and red, respectively. B) Heatmap of variation in PRs expression in inter-genotypes analysis. Genes with higher expression levels in SG are indicated in blue, while those with higher expression levels in RG are indicated in red. R = resistant, S = susceptible, RT and ST = non-inoculated controls, R24 and S24 = 24 HAI, R48 and S48 = 48 HAI.
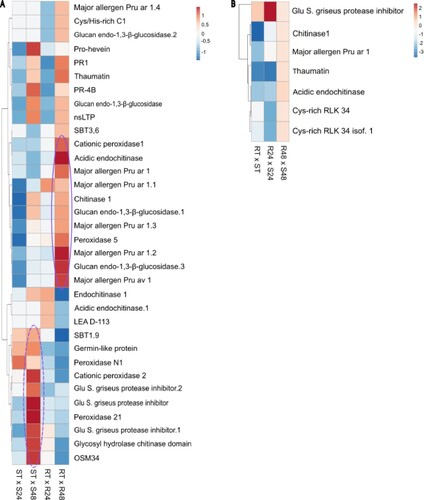
Figure 5 . Clustergram of correlation between gene expression profiles in the Theobroma grandiflorum–Moniliophthora perniciosa interaction and Arabidopsis thaliana under different hormone treatments. Scale bar = indices of hormone action. Color code: red for positive, white for neutral, and blue for negative correlation. MJ = methyl jasmonate (derived from jasmonic acid, JA); ACC = 1-aminocyclopropane-1-carboxylic acid (ethylene); ABA = abscisic acid; IAA = indole-3-acetic acid (auxin); GA3 = gibberellic acid; zeatin (cytokinin); Brassino = brassinosteroids; SA = salicylic acid. Numbers following the hormone abbreviation indicate the time of treatment (30–180 min or 3–9 h). R = resistant, S = susceptible, S24 = 24 HAI, R48 and S48 = 48 HAI.
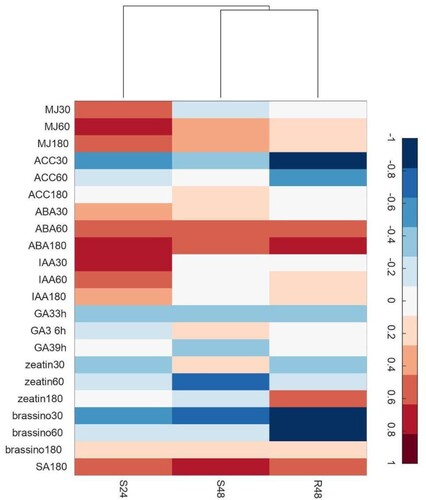
Figure 6 . Expression profile of differentially expressed SAUR genes in the Theobroma grandiflorum–Moniliophthora perniciosa interaction. Heatmap of variation in SAURs expression in intra-genotype analysis. The color scale presents unit variance, with down- and upregulated genes under different conditions indicated in blue and red, respectively. R = resistant, S = susceptible, RT and ST = non-inoculated controls, R24 and S24 = 24 HAI, R48 and S48 = 48 HAI.
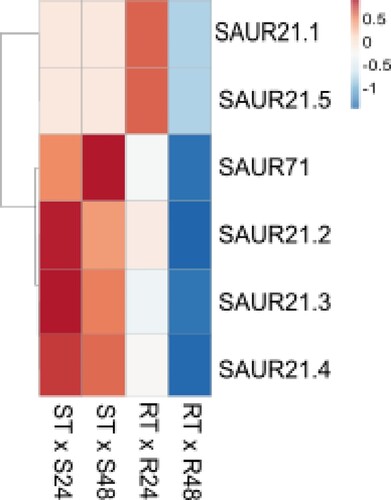
Figure 7 . Graphic representation of GO enrichment analysis of DEGs between susceptible and resistant Theobroma grandiflorum genotypes challenged with Moniliophthora perniciosa. A) Intra-genotype analysis. B) Inter-genotype analysis. Transcripts with higher expression levels in the susceptible genotype are indicated in blue, while those with higher expression levels in the resistant genotype are indicated in red. FE = frequency of expression. R = resistant, S = susceptible, RT and ST = non-inoculated controls, R24 and S24 = 24 HAI, R48 and S48 = 48 HAI.
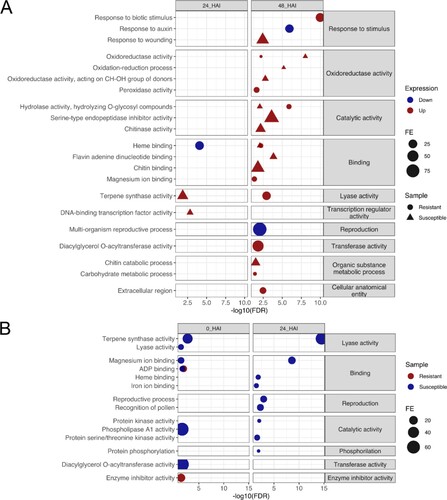
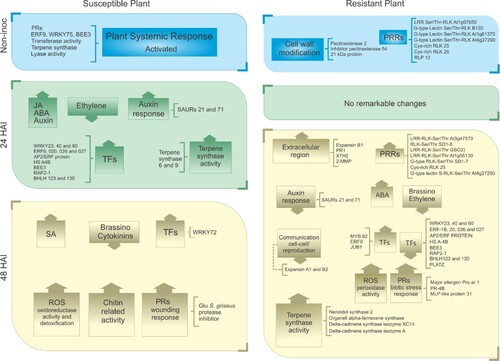
Figure 8 . Schematic representation of the major differences in gene expression between susceptible and resistant cupuassu genotypes (SG × RG) in response to Moniliophthora perniciosa. The differences were compiled using differential expression analysis of the RNA-Seq data of non-inoculated plants, and inoculated plants at 24 and 48 HAI. Up and down arrows indicate up- or down-regulated genes, respectively. Specific identified genes are shown outside the boxes. PRs = pathogenesis-related proteins; PRRs = pattern-recognition receptors; TFs = transcription factors; MJ = methyl jasmonate; ABA = abscisic acid; SA = salicylic acid; ROS = reactive oxygen species.