Figures & data
Figure 1. Bacterial inoculation of Arabidopsis at optimal conditions. (A) Pst DC3000. Leaf symptoms 48 hpi (left) and relative mRNA expression at different time points of PR1 gene after mock or bacterial inoculation (right). (B) Dd 3937. Leaf symptoms 6 hpi (left) and relative mRNA expression at different time points of VSP2 gene after mock or bacterial inoculation (right). Data are means ± SE of three biological replicates. Asterisks indicate significant differences (t-test; *P < 0.05, **P < 0.01, ***P < 0.001).
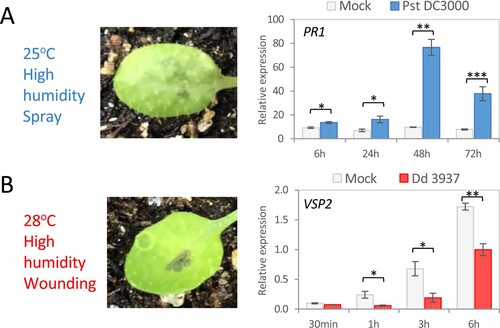
Figure 2. Bacterial inoculation of Arabidopsis at T. urticae optimal conditions. (A) Pst DC3000. Leaf symptoms 48 hpi (left) and relative mRNA expression at different time points of PR1 gene after mock or bacterial inoculation (right). (B) Dd 3937. Leaf symptoms 6 hpi (left) and relative mRNA expression at different time points of VSP2 gene after mock or bacterial inoculation (right). (C) Pst DC3000. Relative mRNA expression at 48h of VSP2, MYC2, and NPR1 genes after mock or bacterial inoculation. (D) Dd 3937. Relative mRNA expression at 6h of PR1, MYC2, and NPR1 genes after mock or bacterial inoculation. Data are means ± SE of three biological replicates. Asterisks indicate significant differences (t-test; *P < 0.05, **P < 0.01).
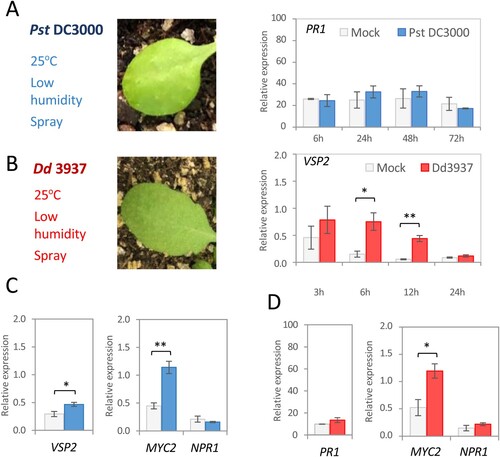
Figure 3. Impact of bacteria inoculation before spider mite infestation on the expression of genes implicated in Arabidopsis defense. The presence of spider mite (first row), bacteria (second row), or heat-inactivated (HI) bacteria (third row) is indicated with (+). Bacteria and HI bacteria were inoculated by spray and kept at 25°C in low humidity conditions. (A) Mites were applied 6 hpi of Dd 3937 or HI Dd 3937. (B) Mites were applied 48 hpi of Pst DC3000 or HI Pst DC3000. In both cases, samples were collected after 24 h of spider mite feeding on the plant. Data are means ± SE of three biological replicates. Different letters indicate significant differences (P < 0.05, One-way ANOVA followed by Tukey HD test).
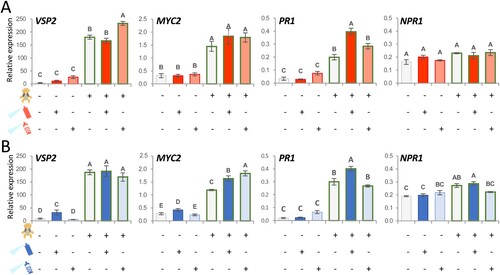
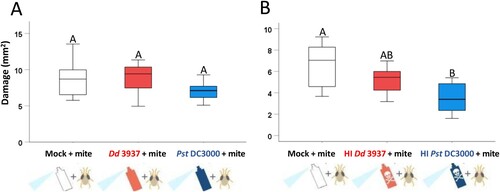
Figure 4. Mite damage on Arabidopsis plants spray-inoculated with bacteria and HI bacteria. Bacteria (A) and HI bacteria (B) were inoculated by spray and kept at 25°C in low humidity conditions. Mites were applied 6 hpi of Dd 3937 or HI Dd 3937, and 48 hpi of Pst DC3000 or HI Pst DC3000. Plants were kept in the same conditions and damage was quantified 4 days after mite treatment. Data are means ± SE of eight biological replicates. Different letters indicate significant differences (P < 0.05, One-way ANOVA followed by Tukey HD test).