
Figures & data
Figure 1. Number of eggs laid by Tuta absoluta females (mean ± SE) on tomato plants exposed to four fertilizer regimes (L = low, M = medium, O = optimal, and H = high) with and without induction by methyl jasmonate (MeJA) in two-choice (a), four-choice (b), and multiple-choice tests (c). An asterisk (*) indicates significant differences between treatments. Different letters indicate significant differences among treatments (two-way analysis of variance, P < 0.05). n = 8; n.s, not significant.
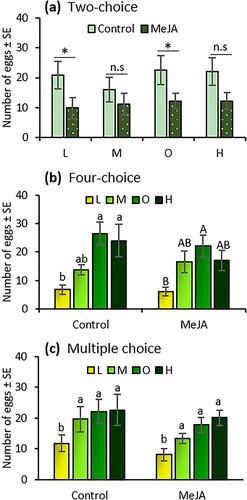
Figure 2. Larval survival (percent ± SE) (a), developmental time from egg to pupa (mean days ± SE) (b), and pupal weights (mean mg ± SE) (c) of Tuta absoluta feeding on tomato plants exposed to different fertilizer regimes (L = low, M = medium, O = optimal, and H = high) with and without induction by methyl jasmonate (MeJA). Uppercase letters indicate significant differences between induced and non-induced plants, while lowercase letters indicate significant difference among fertilizer regimes (two-way analysis of variance, P < 0.05). n = 13.
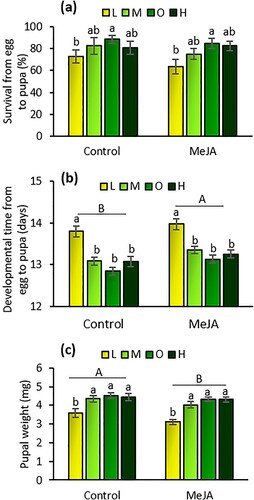
Figure 3. Dry weight (mean g ± SE) (a) and height (mean cm ± SE) (b) of tomato plants exposed to four fertilizer regimens (L = low, M = medium, O = optimal, and H = high) with and without induction by methyl jasmonate (MeJA). Different letters indicate significant differences among treatments (two-way analysis of variance, P < 0.05). n = 8.
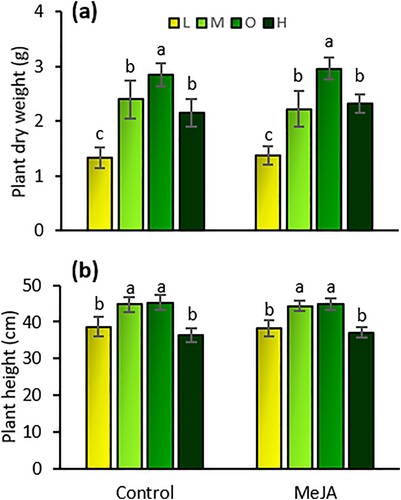
Figure 4. Percentage of nitrogen in the soil (mean percent ± SE) exposed to four fertilizer regimens (L = low, M = medium, O = optimal, and H = high) with and without induction by methyl jasmonate (MeJA). Different letters indicate significant differences between treatments (two-way analysis of variance, P < 0.05). n = 5.
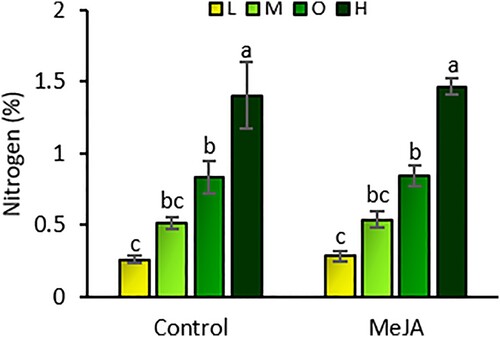
Figure 5. Concentrations of nitrogen (a), phosphorus (b), potassium (c), calcium (d), magnesium (e), and sulfur (f) in the leaves of tomato plants (mean g/kg ± SE) exposed to four fertilizer regimens (L = low, M = medium, O = optimal, and H = high) with and without induction by methyl jasmonate (MeJA). Different letters indicate significant differences among treatments (two-way multivariate analysis of variance, P < 0.05). n = 5.
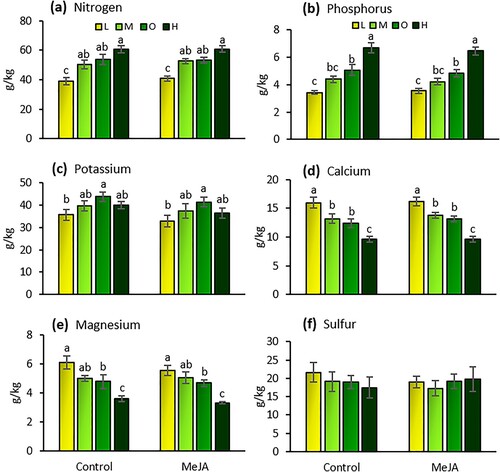
Table 1. Results of two-way analysis of variance (ANOVA) for the effects of fertilizer rates (‘Fertilizer’) and induction by methyl jasmonate (‘MeJA’), and the interaction between these two factors on the levels of nutrients in tomato leaves.
Figure 6. Total phenolic content (mean mg de chlorogenic acid/g fresh tissue ± SE) in tomato leaves exposed to four fertilizer regimes (L = low, M = medium, O = optimal, and H = high) with and without induction by methyl jasmonate (MeJA). Different letters indicate significant differences between treatments (two-way analysis of variance, P < 0.05). n = 5.
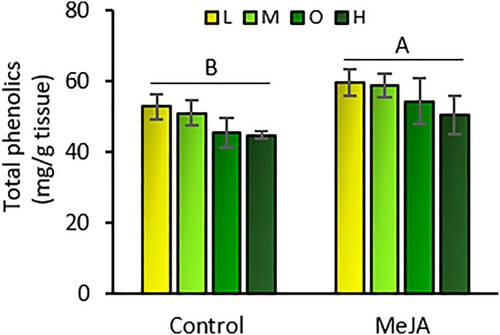
Figure 7. Amounts (mean ng/g fresh tissue ± SE) of (Z)-3-hexenol (a), α-pinene (b), β-pinene (c), β-myrcene (d), 2-carene (e), α-phellandrene (f), α-terpinene (g), o-cymene (h), β-phellandrene (i), limonene (j), β-ocimene (k), γ-terpinene (l), β-caryophyllene (m), humulene (n), and total volatiles (o) emitted from tomato plants under four fertilizer regimes (L = low, M = medium, O = optimal, and H = high) with and without induction by methyl jasmonate (MeJA). Means followed by different letters indicate significant differences among treatments (GLM, P < 0.05). n = 5.
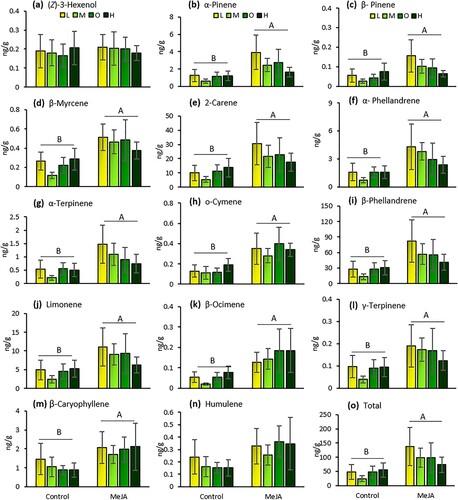
Table 2. Results of two-way analysis of variance (ANOVA) for the effects of fertilizer rates (‘Fertilizer’) and induction by methyl jasmonate (‘MeJA’), and the interaction between these two factors on the amounts of volatiles emitted from tomato plants.