
Figures & data
Figure 1. Location of the PvCHYRs. The ruler on the left represents its location on chromosomes on the reference genome. The tightness of the line represents the density of genes. All this information was provided by the Ensembl Plants database.
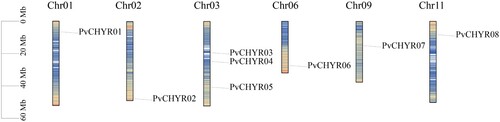
Table 1. The detailed information of PvCHYRs.
Figure 3. The motifs and gene structure analysis of PvCHYRs. (A) The evolution of PvCHYRs; (B) The motifs of PvCHYRs. Ten squares with different colors represent different motifs; (C) The gene structure of PvCHYRs. The green squares represent the UTR region, the yellow squares represent the CDS region, and the pink squares represent the sequence coding CHY domain.
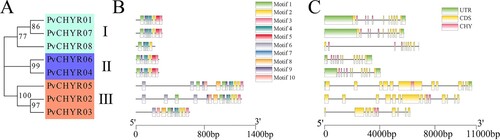
Figure 2. The evolutionary analysis of PvCHYRs. The arc shapes with different colors represent subgroups I, II, and III.
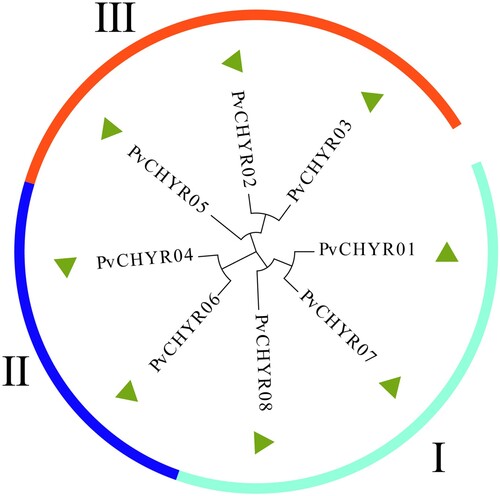
Figure 4. The evolution, motifs, and gene structure analysis of CHYR members in five species, Arabidopsis, rice, maize, soybean, and common bean. Different colored backgrounds represent different subgroups. The outer ring is the motif analysis, while the inner ring is the gene structure analysis of CHYR members.
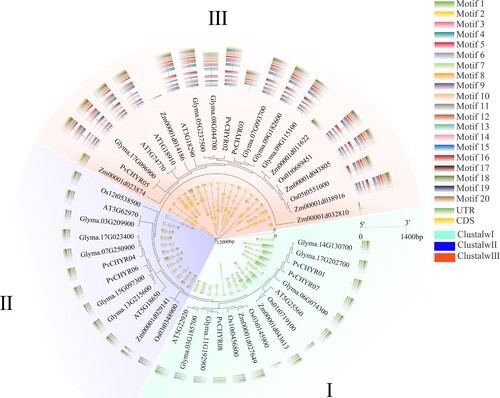
Figure 5. The cis-acting elements analysis of PvCHYRs. (A) The evolution of PvCHYRs. (B) The cis-acting elements of PvCHYRs. The red ones represent the hormone-related elements, the blue ones represent stress-related elements, and the yellow ones represent sprout-related elements.
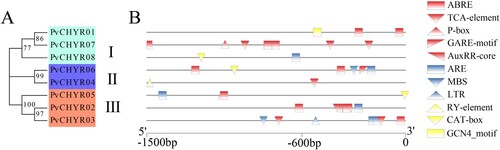
Figure 6. The collinearity analysis of PvCHYRs. (A) The collinear relationship of PvCHYRs. Two middle rings represent the gene density of the genome. (B) The collinear relationship of PvCHYRs with soybean and Arabidopsis. Green squares are common bean’s chromosomes; yellow ones are soybean chromosomes, while red ones represent Arabidopsis’s chromosomes. Red lines represent the collinear relationship with soybean, and blue lines represent the collinear relationship with Arabidopsis.
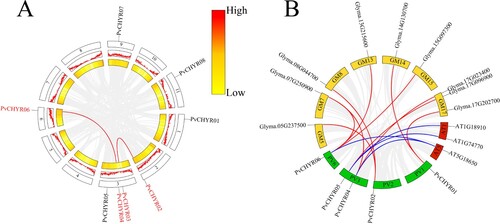
Figure 7. The expression pattern analysis of PvCHYRs in different tissues at the seeding stage. (A) The expression pattern analysis of PvCHYRs in silico. Different colored backgrounds represent different subgroups. The color of the squares, from blue to red, represent the expression level from low to high, respectively. (B-I) The expression pattern analysis of PvCHYRs by qRT-PCR analysis. The columns of three colors represent cotyledons, hypocotyls, and radicles, respectively. The different letters on the column represent the significance (P < 0.05).
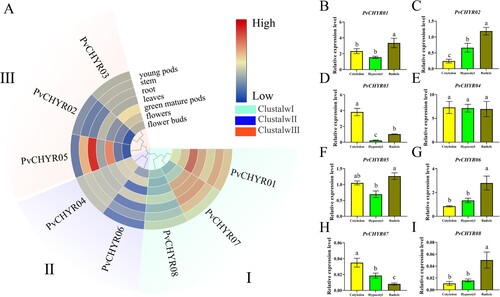
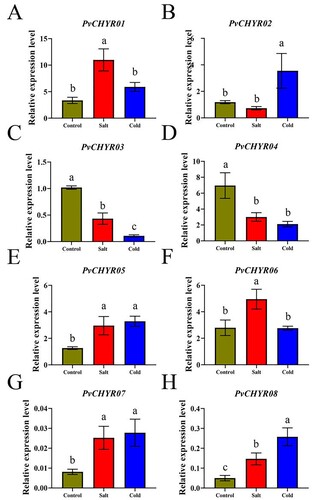
Figure 8. The expression pattern analysis of PvCHYRs in radicle at the seeding stage under abiotic stress. The columns of three colors represent control, salt, and cold, respectively. The different letters on the column represent the significance (P < 0.05).
Supplemental Material
Download Zip (22.1 KB)Data availability statement
All data generated or analyzed during this study are included in this manuscript.