Figures & data
Table 1. Summary of wheat seeds used as a source for isolation of endophytic bacteria from different sampling sites with physio-chemical characteristics.
Table 2. Enumeration and selection of seed endophytic bacteria (CFU/g) from wheat genotypes on different growth media.
Figure 1. Phylogenetic tree constructed using neighbor-joining method grouped on the basis of phyla and 123 endophytic bacterial isolates of various zones. Bootstrap values (>50) are represented by numbers at the nodes on 1000 replication.
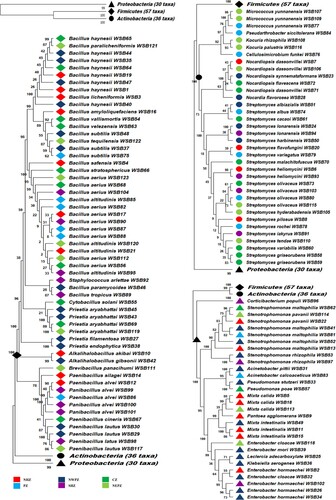
Figure 2. Taxonomic diversity of the obtained representative bacterial endophytic isolates (a) Composition percentage of the isolate at phylum level (b) Abundance heat map of bacterial isolates at genus level present in varied locations.
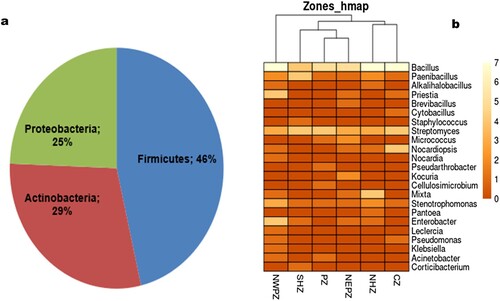
Table 3. Diversity of seed endophytic bacteria across wheat genotypes from different agro-ecological zones.
Figure 3. A diversity profile of endophytic bacteria isolated from wheat seeds of different zones (a) Rarefaction and (b) Hill’s series.
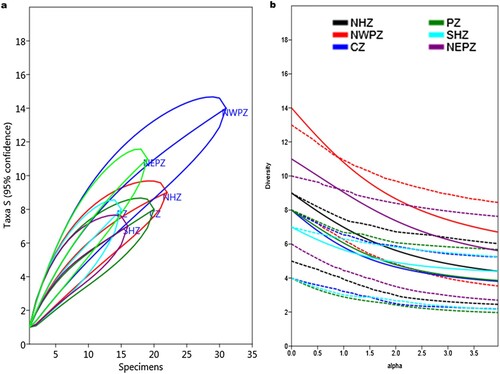
Figure 4. Bacterial alpha diversity indices among different zones. Indices calculated using PAST software after percentile type bootstrapping; Error bars indicate lower and upper values obtained after bootstrapping (N = 9999) (a) Shannon’s index (b) Simpson’s index (c) Evenness and (d) Chao1 index.
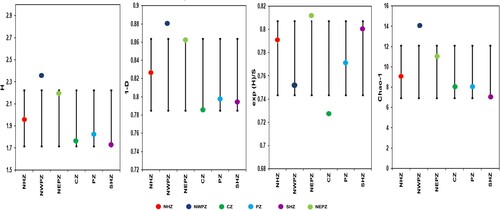
Table 4. Diversity indices of bacterial endophytes associated with seed across genotypes from diverse agro-ecological zones.
Table 5. Wheat seed endophytic bacterial genera-specific distribution of in vitro functional traits.
Table 6. Agro-ecological zones-specific distribution of functional traits across wheat seed endophytic bacteria.
Figure 5. Principal coordinate analysis based on Bray-Curtis dissimilarity matrix for the seed endophytic bacterial community plotted using PAST software.
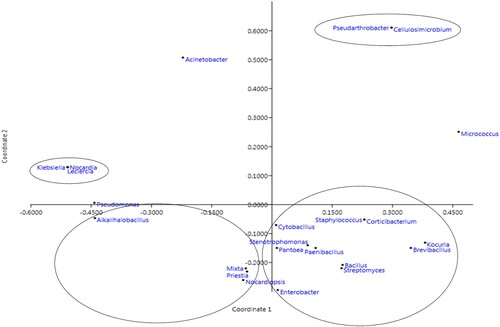
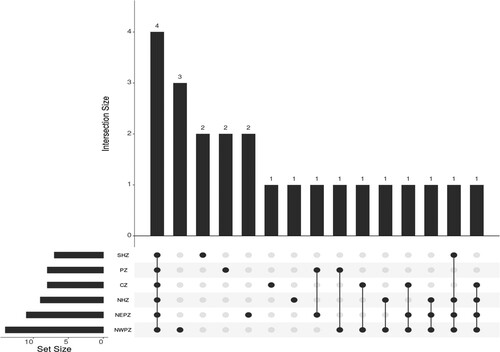
Figure 6. UpSet plot showing the distribution of seed colonizing bacterial genotypes in different zones: In a bar graph, each bar graph displays the sharing genus while intersections display genus in each zone.