
Figures & data
Figure 1. Phylogenetic tree of 87 PLCP members from Arabidopsis thaliana, Citrus sinensis, and Vitis vinifera. Sequence alignment was conducted using MAFFT. The phylogenetic tree was constructed according to the maximum-likelihood (M-L) method using IQ-tree.

Figure 2. Chromosomal location and collinearity analysis of 33 CsPLCPs. (A) Chromosomal location of 33 CsPLCPs across the C. sinensis genome; (B) Collinearity of PLCP genes in C. sinensis and A. thaliana genomes.
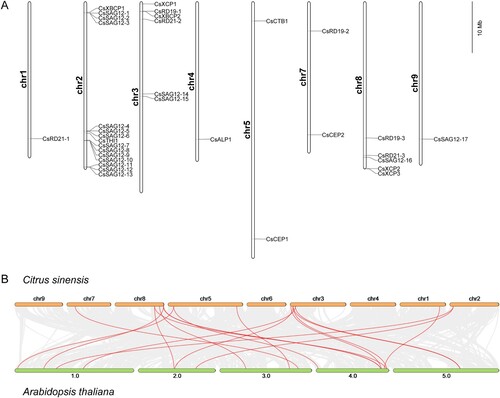
Figure 3. Gene structure and motif analysis of 33 CsPLCPs. (A) Phylogenetic tree of CsPLCPs; (B) Gene structures of CsPLCPs; (C) MEME analysis of CsPLCPs.
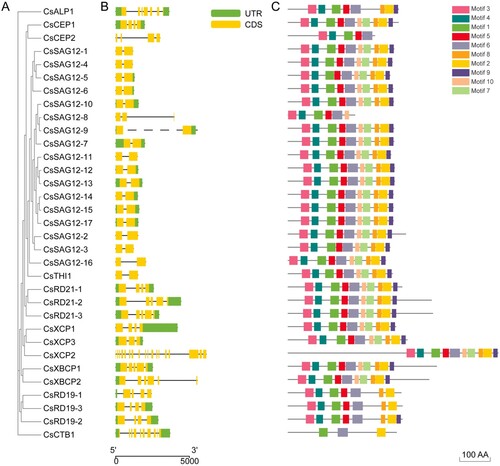
Figure 4. The distribution of cis-acting elements among the promoters of CsPLCPs.
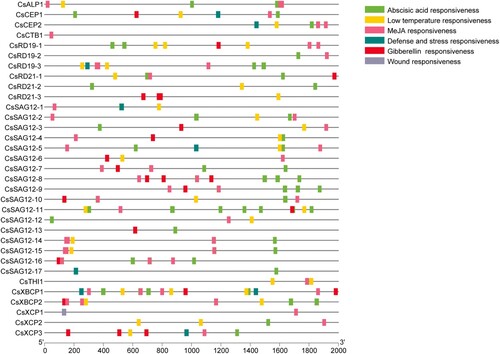
Figure 5. Expression profile analysis of CsPLCP genes. (A) Huanglongbing samples; (B) Citrus bacterial canker disease samples.
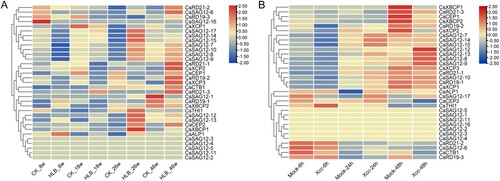
Figure 6. Expression profile analysis of CsPLCP genes in response to CLas infection. Expression patterns of CsALP1 (A), CsCTB1 (B), CsSAG12-14 (C), and CsXBCP2 (D), as determined by qPCR. NB1: young CLas-infected leaves of ‘Newhall’ navel orange; NH1: young uninfected leaves; NB2: mature CLas-infected leaves; NH1: mature uninfected leaves. The CsGAPDH gene was used as the internal control, and the expression level of each PLCP gene in sample NH1 was set as 1. Error bars represent the standard deviation (SD) of three independent biological replicates. Different letters indicate statistically significant differences (one way ANOVA).
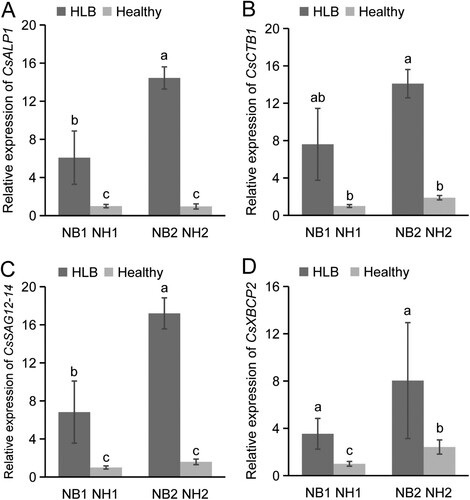
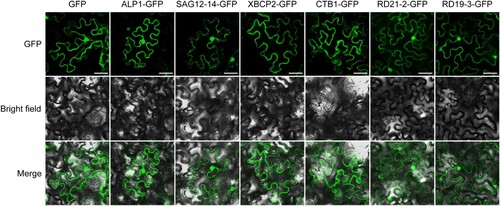
Figure 7. Subcellular localization analysis of CsPLCPs. Free GFP was used as a control. Scale bar, 50 μm.
Supplemental Material
Download Zip (16.9 KB)Data availability statement
All data generated or analysed during this study are included in this manuscript.