Figures & data
Figure 1. Immunoblot of Input, Unbound, and Elution fractions of the RPL18 immunoprecipitation protocol.
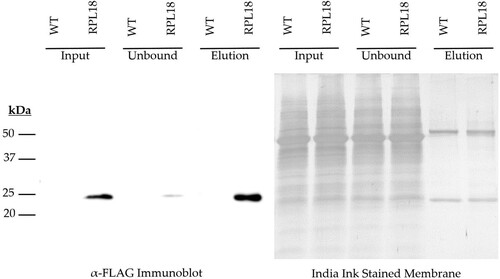
Table 1. Frozen tissue weights of starting materials from Experiment Verification Test.
Table 2. Recovered ribosome associated RNA mass quantity and RNA Integrity (RIN) values.
Table 3. Recovered total RNA mass quantity and RNA Integrity (RIN) values.
Figure 2. Relationships between polysomal and mRNA fractions. A. Frequency of genes expressed in the polysomal fraction divided by all mRNA aligned (total mRNA plus polysomal mRNA) for that gene. B. Log2 of the ratio of the total mRNA divided by the polysomal mRNA across the maximum potential lengths of transcripts. Ratios outside of the inter-quartile ranges are plotted in blue (mRNA higher) or orange (psRNA higher) to visualize the variance in data.
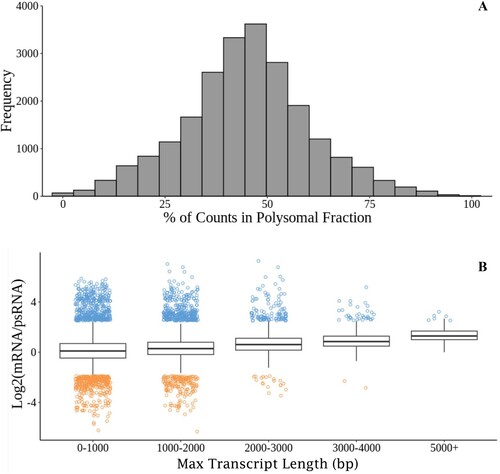
Figure 3. Ratio of gene representation in either the mRNA fraction or polysomal RNA fraction across a representative chromosome. Chromosomes were tiled into 100,000 bp regions, average ratios were taken for each tile. The approximate centromere location is marked in black on the chromosome.
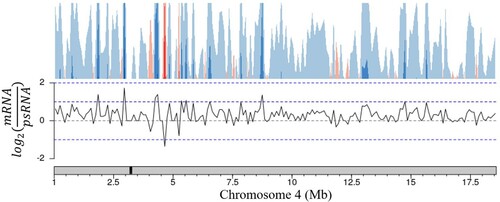
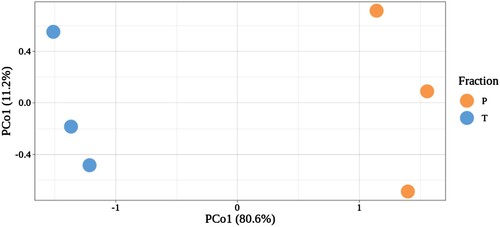
Figure 4. Principal coordinate analysis (PCoA) of three biological replicates of total (T) and ribosome associated (P) reads.