Figures & data
Table 1. Bacterial strains and plasmids.
Figure 1. Genomic context of RHE_CH01783 gene. Source: https://www.ncbi.nlm.nih.gov/gene.
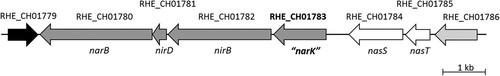
Figure 2. Nitrate-dependent growth (A, C), extracellular nitrite (NO2-) concentration (B, D) and N2O accumulation (E) of R. etli CE3 (WT) (▪) and narK (●). Cells were cultured with NO3- as the sole N source under oxic (A, B) or microoxic (C, D, E) conditions. Data are means with standard error bars from at least two independent cultures assayed in triplicate.
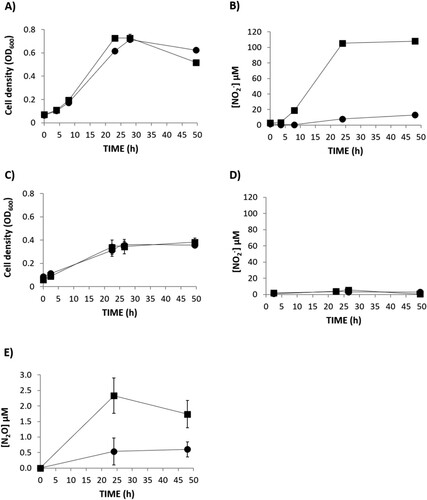
Figure 3. Growth (A) and N2O accumulation (B) by R.etli CE3 (WT) (▪) and narK(●), cultured microoxically with NO2- as the sole N source. Data are means with standard error bars from at least two independent cultures assayed in triplicate.
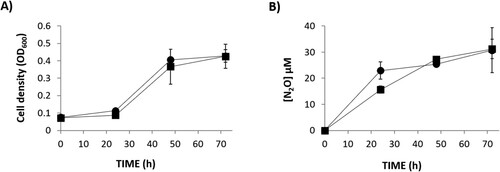
Figure 4. Nitrate-dependent growth (A) extracellular NO2- concentration (B) and N2O accumulation (C) by R.etli WT + NarB+ (□), narK + NarB+ (○) and narK + NarB++NarK+ (Δ), cultured microoxically with NO3− as the sole N source. Data are means with standard error bars from at least two independent cultures assayed in triplicate.
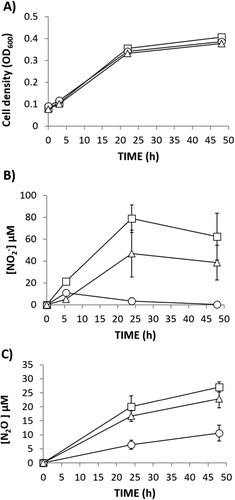
Figure 5. N2O emission by detached nodules from plants inoculated with R. etli CE3 and watered with mineral solution containing 0, 1, 2 or 4 mM KNO3 throughout the growth period or with 10 mM KNO3 for one day (10/1d) or four days (10/4d) before plant harvesting. Data are expressed as the mean value and standard deviation error bars of two independent experiments. In each experiment, 5 replicates collected from ten plants were assayed. Lower-case letters indicate comparisons between nitrate treatments. Same lower-case letters are not statistically significant according to HSD Tukey test at p ≤ 0.05. NFW, nodule fresh weight.
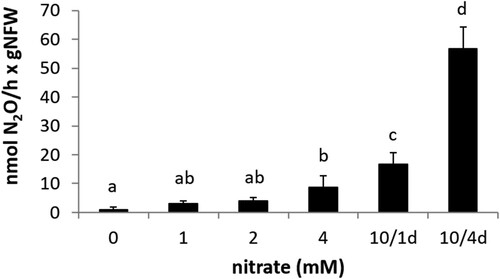
Figure 6. N2O emission by detached nodules from plants inoculated with R. etli CE3 (WT), narB, nirK, norC and narK (black bars) or R. etli WT + NarB+, narB + NarB+, nirK + NarB+, norC + NarB+ and narK + NarB+ (white bars). Plants were treated with 10 mM KNO3 for four days before plant harvesting. Data are expressed as the mean value and standard deviation error bars of two independent experiments. In each experiment, 5 replicates collected from ten plants were assayed. Lower-case letters indicate comparisons between nitrate treatments. Same lower-case letters are not statistically significant according to HSD Tukey test at p ≤ 0.05. NFW, nodule fresh weight.
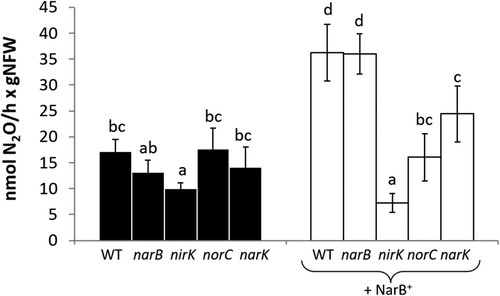
Figure 7. Nitrate reductase (A), nitrite reductase (B), nitric oxide reductase (C) activities and N2O production (D) of bacteroids from nodules of common bean plants inoculated with R. etli CE3 (WT), narB, nirK or norC (black bars) or WT + NarB+, narB + NarB+, nirK + NarB+, or norC + NarB+ (white bars). Data are expressed as the mean value and standard deviation error bars of two independent experiments. In each experiment, bacteroids from 3 replicates collected from ten plants were assayed. Lower-case letters indicate comparisons between strains. Same lower-case letters are not statistically significant according to HSD Tukey test at p ≤ 0.05.
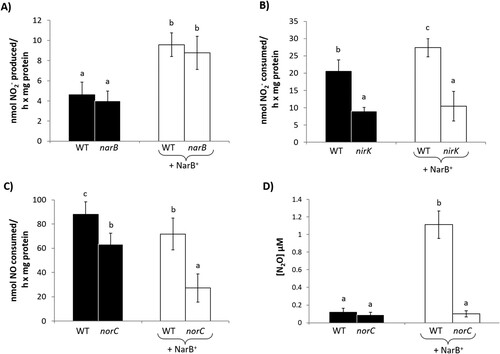
Figure 8. Leghaemoglobin-NO (LbNO) complexes detected by electron paramagnetic resonance (EPR) from whole intact nodules of common bean plants inoculated with R. etli CE3 (WT), norC, WT + NarB+ and norC + NarB + . Nodule EPR signal from soybean plants subjected to NO3− and flooding was used as positive control. For each strain, a representative EPR spectrum observed from triplicate nodule samples from three different nodule harvests is presented.
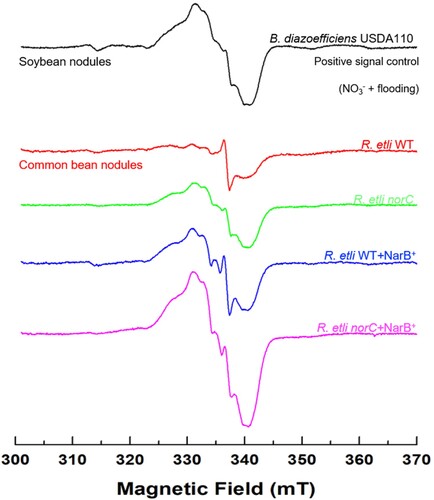
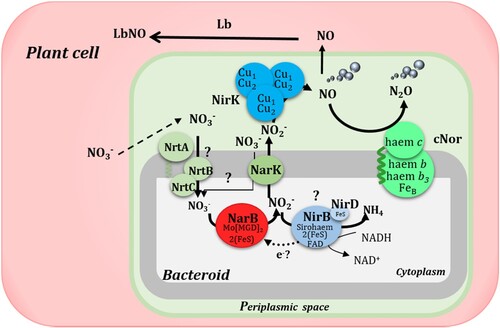
Figure 9. Schematic representation of the contribution of NarB, NarK, NirK and cNor to NO and N2O production in common bean nodules. In this model, NO3− provided in the nutrient solution enters the nodule and can be transported to the cytoplasm of the bacteroid where, by the action of NarB it would be reduced to NO2−. Then, NO2− can be exported to the periplasmic space through NarK and there the denitrifying enzymes NirK and cNor would reduce it to NO and N2O, respectively. In the plant cell, NO produced by the bacteroids would be bound to Lb to form LbNO complexes. Question marks denote mechanisms still unknown. Adapted from Salas et al. Citation2021.