Figures & data
Figure 1. RHG1-induced plant growth promotion in selected BR signaling and biosynthesis mutants. Four-day-old wild type (WT) and mutant (brassinosteroid insensitive 1 (bri1, A), bri1-301 (B) and constitutive photomorphogenic dwarf (cpd, C)) seedlings were treated with a mock (light gray) or RHG1 (dark gray) solution (OD 0.01) and total fresh weight values were determined at 14 days post inoculation (dpi). Values represent boxplots of five biological repeats with their mean (+) and median (horizontal line). Asterisks indicate significant differences between mock and inoculated plants or between RHG1-induced effects in WT and mutant plants (one-way ANOVA or Kruskal–Wallis test; ***P < 0.001; n.s., not significant).
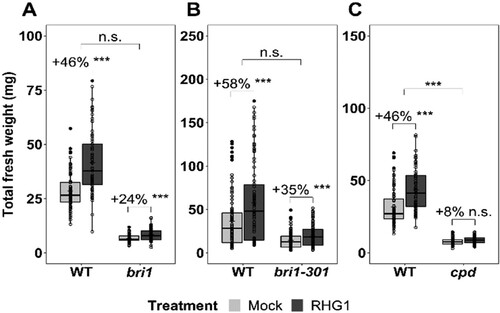
Figure 2. RHG1-induced plant growth promotion in selected immunity rlk mutants. Four-day-old wild type (WT) and mutant (elongation factor-Tu receptor 1 (efr-1, A), flagellin-sensitive 2 (fls2, B) and fls2efr-1 (C)) seedlings were treated with a mock (light gray) or RHG1 (dark gray) solution (OD 0.01) and total fresh weight values were determined at 14 days post inoculation (dpi). Values represent boxplots of four biological repeats with their mean (+) and median (horizontal line). Asterisks indicate significant differences between mock and inoculated plants or between RHG1-induced effects in WT and mutant plants (one-way ANOVA or Kruskal–Wallis test; ***P < 0.001; n.s., not significant).
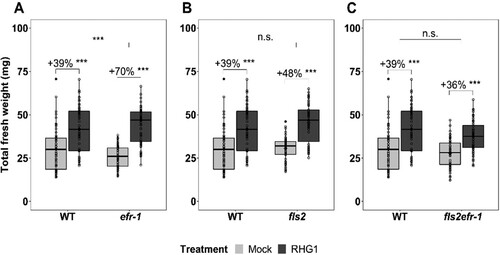
Figure 3. RHG1-induced plant growth promotion in selected two unknown rlk mutants. Four-day-old wild type (WT) and mutant (at3g28040a (A), at3g28040b (B)) seedlings were treated with a mock (light gray) or RHG1 (dark gray) solution (OD 0.01) and total fresh weight values were determined at 14 days post inoculation (dpi). Values represent boxplots of three biological repeats with their mean (+) and median (horizontal line). Asterisks indicate significant differences between mock and inoculated plants or between RHG1-induced effects in WT and mutant plants plants (one-way ANOVA or Kruskal–Wallis test; *P < 0.05, **P < 0.01, ***P < 0.001; n.s., not significant). (C) Schematic representation of AT3G28040 protein structure with amino acid number marked for the different domains. LRRs: leucine-rich repeats, TD: transmembrane domain, KD: kinase domain.
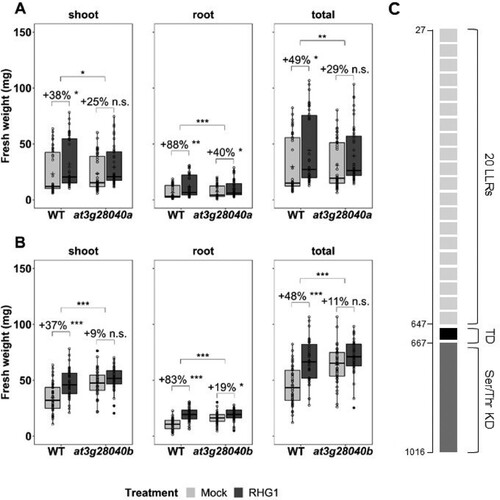
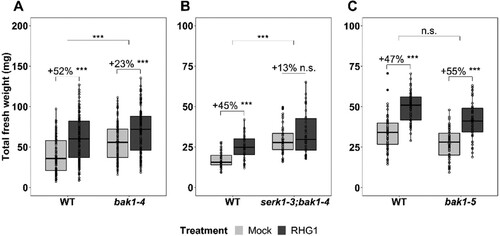
Figure 4. RHG1-induced plant growth promotion in selected rlk coreceptor mutants. Four-day-old wild type (WT) and mutant (brassinosteroid insensitive 1-associated kinase 1–4 (bak1-4, A), somatic embryogenesis receptor-like kinase 1-3; bak1-4 (serk1-3;bak1-4, B) and brassinosteroid insensitive 1-associated kinase 1–5 (bak1-5, C)) seedlings were treated with a mock (light gray) or RHG1 (dark gray) solution (OD 0.01) and total fresh weight values were determined at 14 days post inoculation (dpi). Values represent boxplots of nine (A) three (B) or four (C) biological repeats with their mean (+) and median (horizontal line). Asterisks indicate significant differences between mock and inoculated plants or between RHG1-induced effects in WT and mutant plants (one-way ANOVA or Kruskal–Wallis test; *P < 0.05, **P < 0.01, ***P < 0.001; n.s., not significant).