Figures & data
Figure 1. Proportion of rice genotypes from Eastern and Southern Africa (n = 201) in which the salinity-tolerant Saltol allele is present. The collection included 102 landraces and 99 improved cultivars from Eastern and Southern Africa. The genotyping was conducted by 1k RiCA (Agriplex Genomics). The presence of Saltol was significantly more frequently associated with improved genotypes compared with landraces (χ2 = 8.17, df = 1, p-value = 0.004).
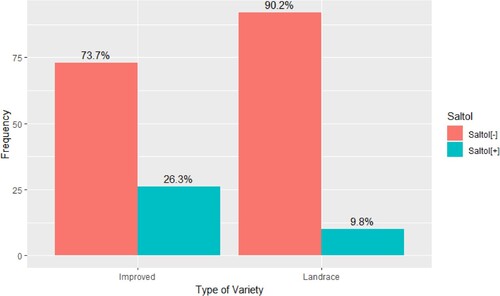
Figure 2. Proportion of phenotypically salt-tolerant (SES Score < 6) rice genotypes from Eastern South African segregated into landraces and improved cultivars (n = 201). The collection included 102 landraces and 99 improved genotypes from Eastern and Southern Africa. Phenotypic tolerance is not significantly different between the two types of genotypes (χ2 = 1.06, df = 1, p-value = 0.30).
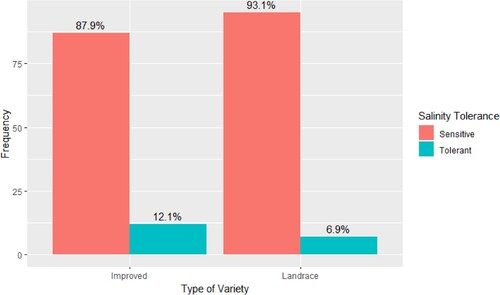
Figure 3. Saltol alleles and visual scores for the genotypes selected from rice-growing areas of Eastern and Southern Africa, screened for 21 days at 12 dS m−1 salt concentration. The scores are the average of three replication of which 1 represents (highly tolerant), 3–4.3 (tolerant), 5–5.7 (moderate tolerant), 6–8.3 (susceptible), and 9 (highly susceptible). Saltol alleles were determined by 1K-RiCA Single nucleotide polymorphism (SNP) assay and the bar colors indicate the Saltol allele. + and − indicate the presence and absence of the Saltol allele respectively; ? indicates genotypes that were not called. Aro refers to aromatic rice and Aus refers to aus rice subgroups.
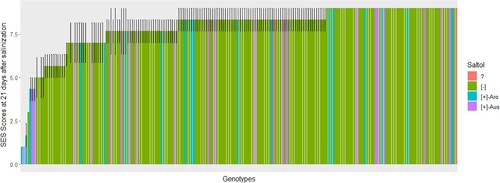
Figure 4. Spatial distribution of rice genotypes showing the presence and absence of Saltol in the genotypes collected from Tanzania. The Saltol allele was identified after genotyping through 1K-Rice Custom Amplicon (1K-RiCA assay), as indicated by the symbol color. Aro refers to aromatic rice and Aus refers to aus rice subgroups.
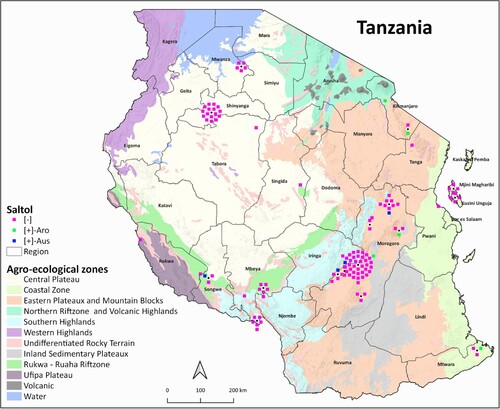
Figure 5. The percentages of rice genotypes possessing the salinity-tolerant Saltol allele in different agro-climatic zones of Tanzania. The percentages are calculated based on the number of genotypes in which the Saltol allele was present out of the total number of genotypes studied from each agro-ecological zone.
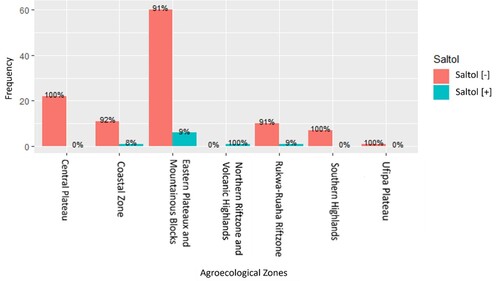
Figure 6. The spatial distribution of the screened rice genotypes indicating the lowest to highest Standard evaluation system (SES) scores from rice-growing areas of Tanzania screened for 21 days at 12 dS m−1 salt concentration. The red, purple, and blue colored dots highlight the genotypes with low visual scores indicating tolerance while green, gray and yellow highlight genotypes with high visual scores indicating susceptibility (1: highly tolerant, 3–4.3: tolerant, 5–5.7: moderate tolerant, 6–8.3: susceptible, 9: highly susceptible).
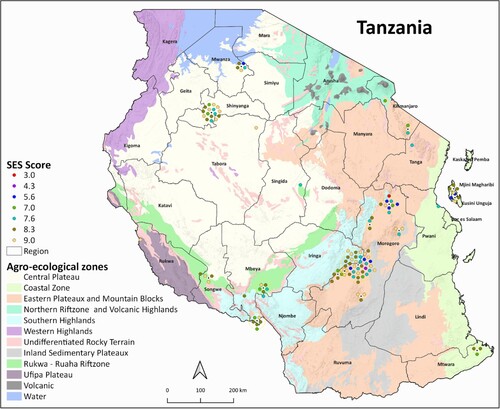
Figure 7. The distribution of rice genotypes categorized as tolerant (scoring <6 under phenotypic screening) in various agro-climatic zones of Tanzania. The number of genotypes studied varied across different zones.
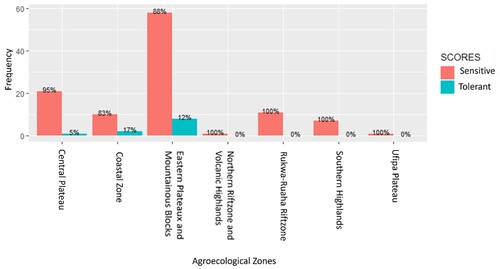
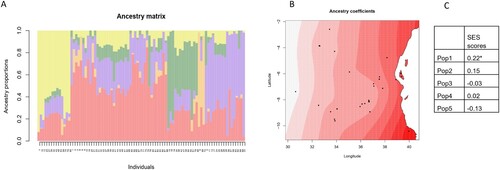
Figure 8. Spatial population structure analysis generated using the TESS3 package in R. (A) Proportions of different ancestral populations within each genotype (K = 5, shown on the y-axis), with the genotype number shown on the x-axis (as indicated in Table 1). (B) Spatial visualization of Pop1 ancestry coefficients. Each point shows one accession, with darker shades indicating greater representation of the population. (C) Correlation coefficients between ancestry coefficients and SES scores from the phenotypic screening (*: p < 0.05).