
Figures & data
Table 1. Culturing medium composition at different potato transformation stages. PCM (Potato co-culture media), CIM (Callus induction medium), SIM (Shoot induction medium), and RIM (Root induction medium).
Figure 1. Sequence alignment, phylogenetic analysis, and motif prediction of StDREB30 (A) Multiple sequence alignment of StDREB30 with other plant species ScDREB5 (AMT92113.1), AtDREB1A (BAA33791.1), AtDREB2A (BAA33794.1), AtB14 (ABE65896.1),AtRAP2.1 (OAP00017.1), At1g7760 (ABD57508.1), OsDREB2A (AFB77198.1), OsAB14 (C7J2Z1.1), Os02g43940.1 (XP_015626317.1), ZmDBF1 (AAM80486.1), MsDREB5(AFM84627.1), GhDBP1 (AAO43165.1), GmDREB2 (ABB36645.1), StDREB30 (PGSC0003DMG400009475) LeDREB3 (AAO13360.1), GmDREB3 (AAZ03388.1), DRFL2C (ABC74511.1), AtTINY (NP_197953.1) and ZmDBF2 (AAM80485.1). Identical amino acid residues in all aligned sequences are highlighted by an asterisk (B) A phylogenetic tree was constructed using the neighbor-joining method with Poisson correction (pairwise deletion) and 1000 bootstrap value of replicates used to assess the robustness of the tree (C) Motif prediction of StDREB30 with other DREB proteins.
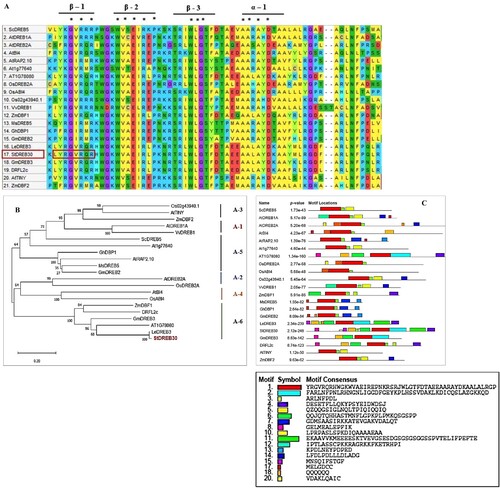
Figure 2. Schematic representation and Colony PCR confirmation of the StDREB30 gene (A) Schematic representation of pCAMBIA 1301::StDREB30 used for Agrobacterium-mediated potato transformation. LB: Left T-DNA border, RB: Right T-DNA border, HPT II: Hygromycin transferase gene, CaMV: Cauliflower mosaic 35 S promoter. (B) 795 bp StDREB30 gene was confirmed in binary vector pCAMBIA 1301 through colony PCR. Lane M contains a 1 kb ladder, Lane 1 contains negative control and Lane 2–7 contains positive clones containing the 795 bp StDREB30 gene.
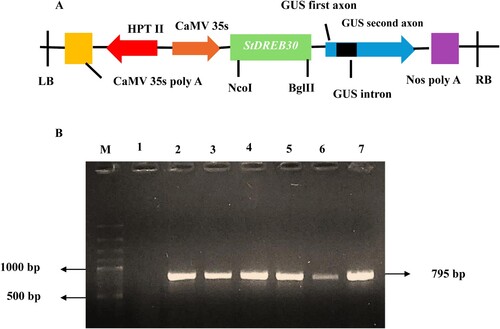
Figure 3. Stages of potato transformation (A) Inoculation of leaf disks on MS media (B) Internode inoculation on co-cultivation media (C) Callus generation from edges of intermodal explants after 9 days of inoculation on callus medium (D) Shoot regeneration from callus cultures (E) Propagation of transformed shoots on shooting medium (F) Shoots multiplication and elongation after 4 weeks in culture (G) Culturing of excised shoots on rooting medium (H) Fully grown transformed plants.
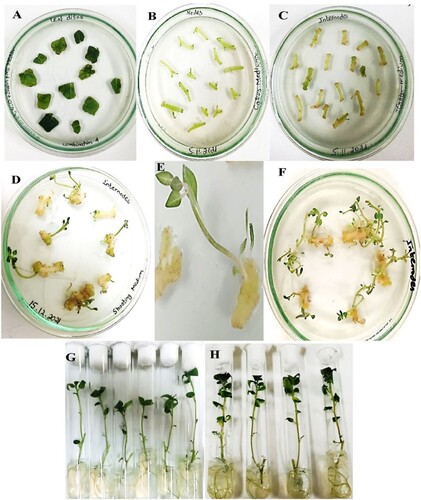
Figure 4. Confirmation of OEpotato plants GUS histochemical assay of (A1) Roots (A2) Nodes and internodes stem parts of NT potato plants as controls (B1) Roots (B 2) Nodal and internodal sections of OE potato plants. NTexplants showed no color after incubation with X-Gluc for 16 hr at 37 °C while OE explants developed a deep blue color that depicts successful potato transformation. (C) Verification of OEpotato plants by PCR amplification from genomic DNA with hygromycin (hptII) gene-specific primers. The amplified fragment corresponds to the hptII gene of 686 bp. Lane M denotes 1 kb Marker, and Lane1–L 4 contains positive OE plants.
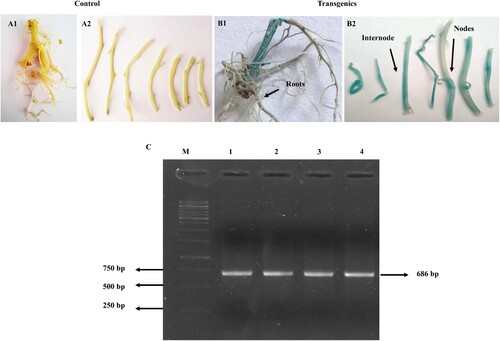
Figure 5. Overexpression of the StDREB30 gene confers drought tolerance in transgenic potato plants. Tissue-specific expression analysis of StDREB30 by qRT-PCR in response to drought stress. (A) Indicates tissue-specific expression analysis of StDREB30 in shoots (B) leaves (C) roots of OE potato plants overexpressing StDREB30 and NT plants under 14 days of drought stress followed by 3 days of rewatering. Each value is expressed as a means of 3 biological replicates. Different asterisk (*) represents significant differences (p ≤ 0.05). Statistical differences were calculated using ANOVA *P < 0.05, **P < 0.01, ***P < 0.001, ****P < 0.0001. Phenotypes of potato plants under drought stress treatment. (D) Phenotypes of controls (NT) D1-D2 and D3-D4 OE plants (E) Comparison of growth condition in controls (NT) E1-E3 and OE plants E4-E6 on the 14th day of drought stress (F) Wilting symptoms observed in F1 control (NT) in comparison to healthy F2 OE plant on the 14th day of stress.
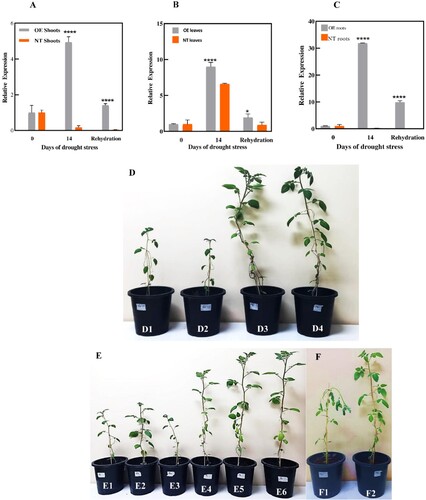
Figure 6. Potato plants under 20% PEG6000 osmotic stress treatment. Phenotypes of NT and OE potato plants under 20% PEG6000 stress for 24 hr. Figures (A) and (D) shows normal phenotypes of NT and OE plants at the start of PEG stress. Figures (B) and (C) shows clear wilting and defoliation of leaves in NT plants as the osmotic stress reaches 24 hr. (E) and (F) shows OE plants withstand PEG stress for 24 hr with no wilting and defoliation. qRT-PCR analysis of the StDREB30 gene in OE plants and NT plants treated with 20% PEG6000 was performed to analyze relative expression levels of the StDREB30 gene (G) shoots (H) leaves (I) roots of OE and NT plants treated with osmotic stress for 0, 3, 6,12, and 24 hr. Each value is expressed as a means of 3 biological replicates. Different asterisk (*) represents significant differences (p ≤ 0.05).
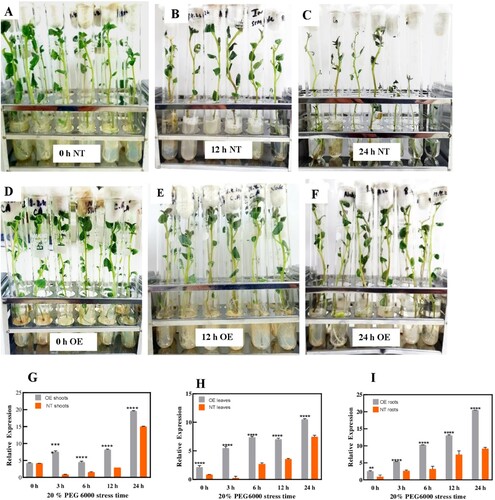
Figure 7. Changes in biochemical activities in OE potato plants and NT plants during drought-stress treatment. Potato plants were exposed to drought stress treatment for 14 days followed by 3 days of rewatering for recovery. SOD activity (A, B, and C), CAT activity (D, E, and F), MDA (G, H, and I), and APX activity (J, K, and L) were measured in shoots, leaves and roots of OE and NT plants, respectively. Each value is expressed as a means of 3 biological replicates. Different asterisk (*) represents significant differences (p ≤ 0.05). Statistical differences was calculated using ANOVA *P < 0.05, **P < 0.01, ***P < 0.001, ****P < 0.0001.
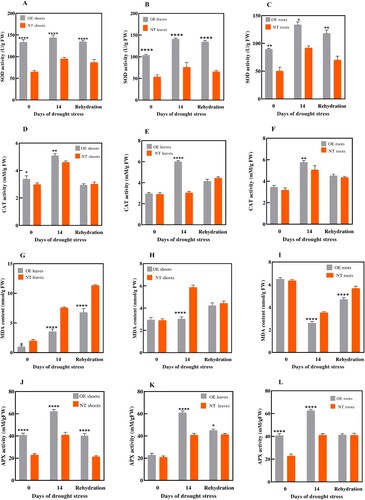
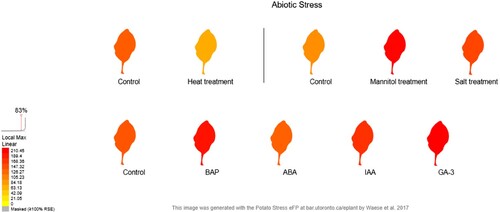
Figure 8. In silico expression analysis of StDREB30 gene under heat, mannitol, salt, BAP, ABA, IAA, and GA3 stress calculated by potato eFP browser.
Supplemental Material
Download MS Word (391.9 KB)Data availability statement
All data supporting the findings of this study are available within the paper.