Figures & data
Table 1. Patients demographics. Where no missing values are reported, all values were available. ᵞDuration of hearing aid usage is the difference between the age at cochlear implantation and the age at first hearing aid fitting. ᵝDuration of severe to profound hearing loss is the difference between the age at cochlear implantation and the age at onset of severe to profound hearing loss. *CI side is only relevant for implanted patients (i.e., N = 50 for full sample and N = 31 for native English-speaking sample)
Figure 1. Study design. M1 refers to 1-month post-surgery. M3, M6, and M12 refer to 3, 6, and 12 months post-activation, respectively
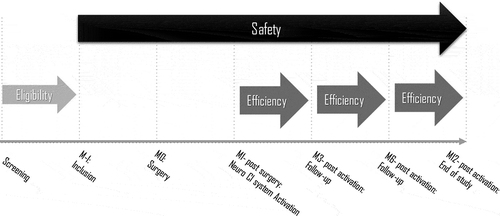
Figure 2. Adverse event classification used following Cohen and Hoffman (1991). The numbers in brackets represent the number of adverse events experienced in the period from surgery to 12 months post-activation. * The treating surgeon also recorded if any of the adverse events was fatal or resulted in explantation or sound processor usage discontinuation. None of these occurrences was reported
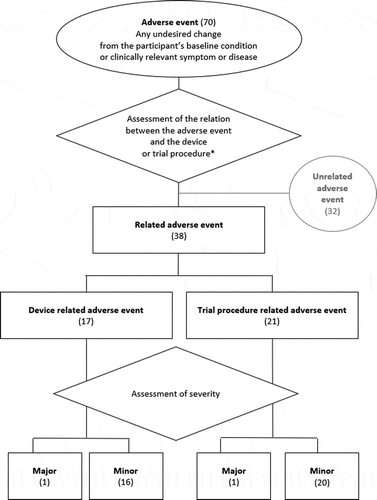
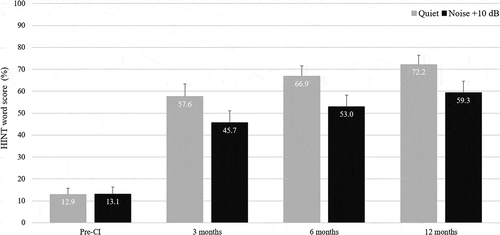
Figure 3. Mean HINT results in quiet (HINT-Q) and in noise (HINT-N) pre-cochlear implantation and at 3, 6, and 12 months post-activation (N = 31). The error bars represent standard deviations