Figures & data
Figure 1. RNS System chronic intracranial electroencephalography (RNS cEEG).(center) RNS System neurostimulator is shown connected to two four-contact depth leads placed in bilateral hippocampi (green), though cortical strip leads and many other lead locations are also possible. (A) Four-channel bipolar-montaged RNS electrocorticogram (ECoG) showing interictal epileptiform activity (IEA; spikes, in this example) arising independently from the bilateral hippocampi. Hourly counts of detections of IEA are stored on the neurostimulator. Tick marks on x-axis indicate time in seconds, as in panel (B), which shows ECoGs that capture electrographic seizures of left or right hippocampal onset. (C) Magnet-triggered ECoGs. Magnet swipe over the RNS neurostimulator triggers ECoG storage, typically 60-sec before the swipe and 30-sec after the swipe. (top) Patient magnet swipe (red arrowhead and blue flag ‘M’) just after the offset of a seizure indicates that the event was perceptible to the patient. (bottom) Data from one patient showing that, over months, magnet swipes (gray flag ‘M’) to mark clinical seizures tend to occur on the rising phases of multidien cycles of daily IEA (blue bars). (D) Temporal trends in epileptiform activity. (top) Each row is a histogram representing normalized weekly average detections of IEA binned by hour of the day, revealing consistent circadian cycles with most detections occurring during the night (day/night represented by sun/moon icons). (middle) Long Episodes (proxy for electrographic seizures) demonstrate approximate two-week periodicity and a strong tendency for seizures to cluster over 1–3 days. (bottom) Daily IEA counts sharply decline after initiation of a new anti-seizure medication (blue arrowhead), possibly indicating efficacy of this medication. Blue lines in middle and bottom panels represent 28-day rolling average of the data. Data stored on the neurostimulator is synchronized with a secure online data bank (Patient Data Management System, PDMS) for review by clinicians
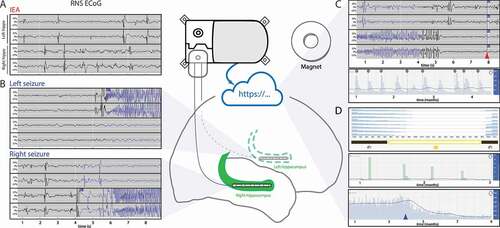
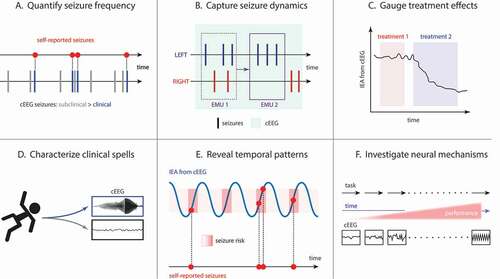
Figure 2. Clinical and research applications of RNS cEEG. (A) cEEG can reveal that subclinical (electrographic) seizures outnumber clinical seizures reported by patients. (B) In patients with bitemporal epilepsy, seizure lateralization determined by short-duration studies, like video-EEG in the Epilepsy Monitoring Unit (EMU), is prone to error due to undersampling. For example, one admission (EMU 1) might capture 3 left and 2 right seizures, while an admission of the same duration performed at a later time (EMU 2) could, by chance, capture 3 left seizures only, potentially leading to different conclusions about the patient’s surgical candidacy. The longer recording duration of cEEG (light green shading) can yield more accurate estimates of seizure lateralization. Analysis of epileptiform activity in RNS cEEG can help determine effective treatments (C; treatment 2 suppresses IEA to a greater extent than treatment 1) and can help characterize clinical spells based on the presence or absence of epileptiform activity in corresponding ECoGs (D). (E) Cycles of IEA (blue line) help determine periods of time (often the rising phases of these cycles) when seizures (red dots) are more likely to occur, though seizures may not occur during every high-risk period (dark red shading). (F) As a neuroscience research tool, RNS cEEG can reveal neurophysiological correlates of task performance in ambulatory subjects serially over long periods of time