Figures & data
Figure 1. SEM image of GaP/GaInP NWs. Top, 80 nm in diameter GaP/GaInP nanowire; bottom, 40 nm in diameter GaP/GaInP NW. Scale bar: 1 μm, tilt: 0°.
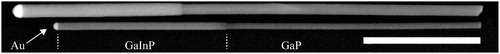
Figure 2. Size distributions of GaP/GaInP NWs. (a) Diameter distribution of NWs before Daphnia filtering measured using SEM. (b) Length distribution before Daphnia filtering measured using dark field optical microscopy. (c) Length distribution after 24 h of Daphnia filtering measured using dark field optical microscopy. (d) Median length and standard deviation for 40 nm and 80 nm NWs before and after Daphnia filtering, measured using dark field optical microscopy (***p < 0.001, Kruskal–Wallis test).
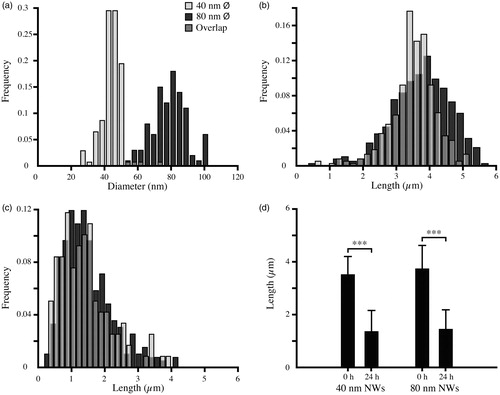
Figure 3. Dark field optical micrographs of NW suspensions. (a) 40 nm NWs before Daphnia filtering, (b) after 24 h Daphnia filtering of 40 nm NWs, (c) 40 nm NWs after 24 h incubation in Daphnia water, (d) 80 nm NWs before Daphnia filtering, (e) after 24 h Daphnia filtering of 80 nm NWs, (f) 80 nm NWs after 24 h incubation in Daphnia water. Scale bar: 100 μm.
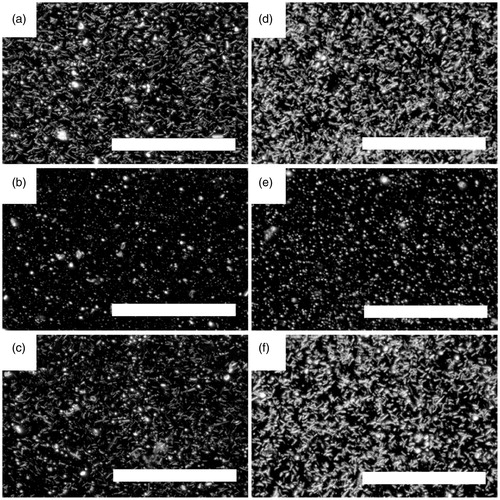
Figure 4. Representative confocal images of Daphnia after 24 h of NW exposure. Control Daphnia (a), Daphnia after 24 h of 40 nm NW filtering (b), Daphnia after 24 h of 80 nm NW filtering (c). Stained with Alexa Fluor 488 – Phalloidin (green, actin) and Hoechst 33342 (blue, DNA). The GaInP fluorescence can be seen in red. (See online version of the paper for a color image.)
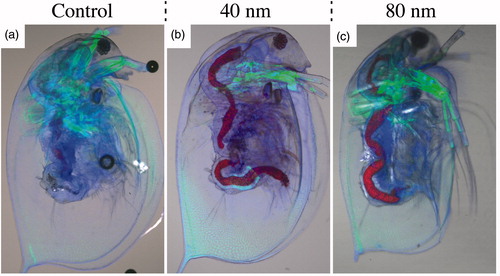
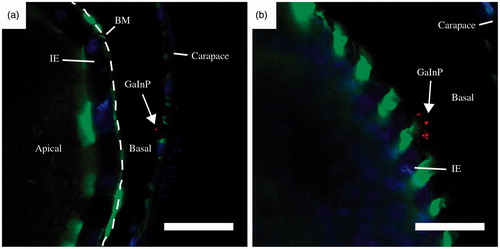
Figure 5. Representative confocal images of Daphnia intestine after 24 h of NW exposure. After 40 nm NW filtering (a) and (c) and after 80 nm NW filtering (b) and (d). Scale bars: 20 μm. Stained with Alexa Fluor 488 – Phalloidin (green, actin) and Hoechst 33342 (blue, DNA). The GaInP fluorescence can be seen in red. BM – basement membrane (dashed line), IE – intestinal epithelium, PM– peritrophic membrane (dotted line). (See online version of the paper for a color image.)
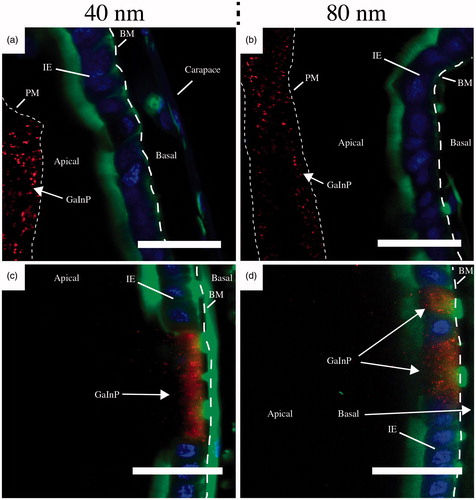
Figure 6. Representative confocal images of translocated 40 nm NWs after 24 h of NW exposure. Scale bars: 20 μm. Stained with Alexa Fluor 488 – Phalloidin (green, actin) and Hoechst 33342 (blue, DNA). The GaInP fluorescence can be seen in red. BM – basement membrane (dashed line), IE – intestinal epithelium. (See online version of the paper for a color image.)