
Figures & data
Figure 1. A systems toxicology paradigm. The pathway aims to extrapolate all available toxicological information to humans using a combination of in silico methods and toxicokinetics modeling. Molecular level analysis provides toxicological information preceding cellular and physiological manifestation of effects. In vitro methods investigate cellular effects of direct exposure to a substance. In vivo studies provide an examination of a variety of tissues in controlled environments. Human studies require biomonitoring, sampling and tissues/fluids analysis. Population level effects is the culmination of this extrapolation with supporting evidence typically requiring longitudinal observations and large-scale data gathering.
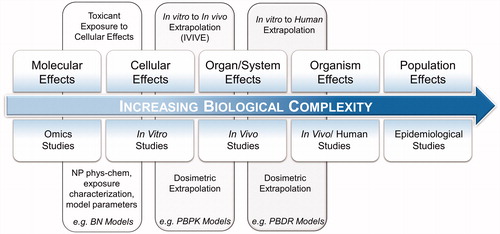
Figure 2. Workflow of BN construction and evaluation.
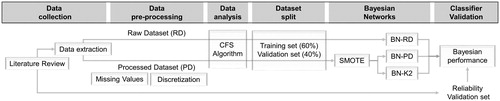
Table 1. Processed Dataset (PD) inputs and outputs extracted from literature review and their states (categories)/numerical ranges and abbreviations used in this study.
Figure 3. Results of 10-fold cross-validation Correlation Feature Selection algorithm applied in processed dataset. (A) Inter-relationship of input variables, (B) relationship between the input and output variables.
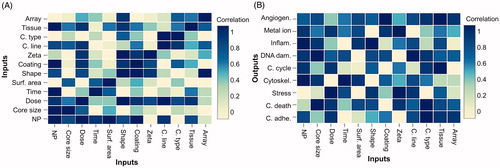
Figure 4. Graphical structure of the BN-PD model. Center: Structure based on correlation between the inputs. Perimeter: BN-PD structures based on output prediction ability of inputs.
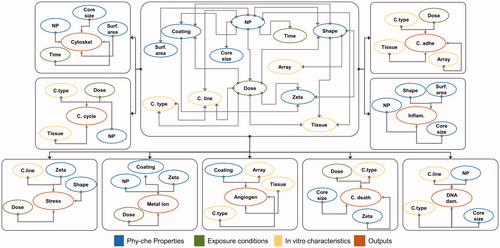
Figure 5. Accuracy of the classifiers. The validation of the models is carried out for each cellular effect separately. (A) Internal validation using a 10-fold cross-validation process with the training 60% datasets. (B) External validation using the validation 40% datasets. (C) Reliability validation using the reliability dataset. BN-PD: BN constructed from pre-processed dataset; BN-K2: BN automated constructed using K2-algorithm; BN-RD: BN constructed from raw dataset.
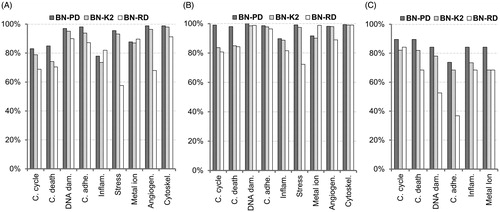
Figure 6. Sensitivity of the classifiers. The validation of the models is carried out for each cellular effect separately. (A) Internal validation using a 10-fold cross-validation process with the training 60% datasets. (B) External validation using the validation 40% datasets. (C) Reliability validation using the reliability dataset. BN-PD: BN constructed from pre-processed dataset; BN-K2: BN automated constructed using K2-algorithm; BN-RD: BN constructed from raw dataset.
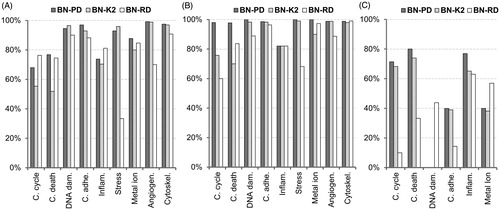
Figure 7. Matthews correlation coefficient of the classifiers. The validation of the models is carried out for each cellular effect separately. (A) Internal validation using a 10-fold cross-validation process with the training 60% datasets. (B) External validation using the validation 40% datasets. (C) Reliability validation using the reliability dataset. BN-PD: BN constructed from pre-processed dataset; BN-K2: BN automated constructed using K2-algorithm; BN-RD: BN constructed from raw dataset.
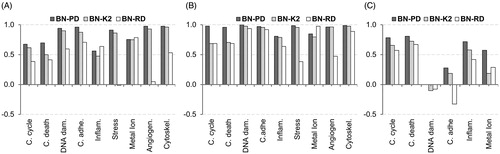
Table 2. Normalized information gain for each model outcome (bold) by input attributes. Only the top five most influential attributes are shown.
Supplemental Material
Download MS Excel (59.3 KB)Data availability statement
The data that support the findings of this study are available at (Furxhi Citation2019).