
Figures & data
Figure 1. Box and whisker plots of total-Si concentration in human (post mortem) liver, spleen, kidney, jejunum, and ileum. The boxes represent the upper 25% quartile (Q3), median (Q2), and lower 25% quartile (Q1) concentrations, respectively. The whiskers indicate 1.5IQR (Q3–Q1).
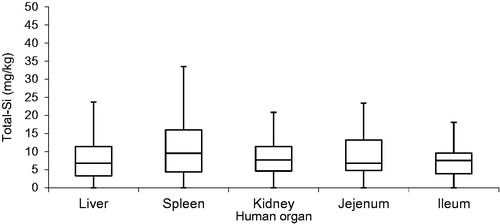
Figure 2. Box and whisker plots of total-Ti concentration in human (post mortem) liver, spleen, kidney, jejunum, and ileum. The boxes represent the upper 25% quartile (Q3), median (Q2), and lower 25% quartile (Q1) concentrations, respectively. The whiskers indicate 1.5IQR (Q3–Q1).
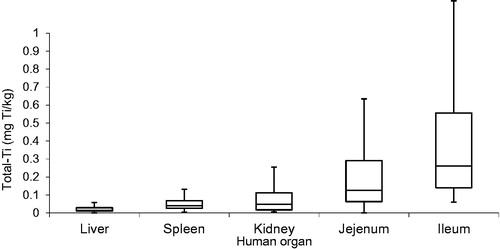
Table 1. Summary of total-Si and -Ti concentrations in the organs.
Figure 3. TiO2 particles in human (post mortem) tissue. Time scan of the spICP-MS analyses of a human tissue sample.
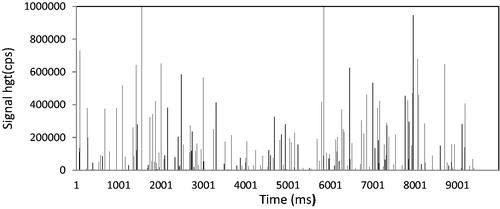
Figure 4. Box and whisker plots of the SiO2 particle concentration in human (post mortem) organs. The boxes represent the upper 25% quartile (Q3), median (Q2), and lower 25% quartile (Q1) concentrations respectively. The whiskers indicate 1.5IQR (Q3–Q1).
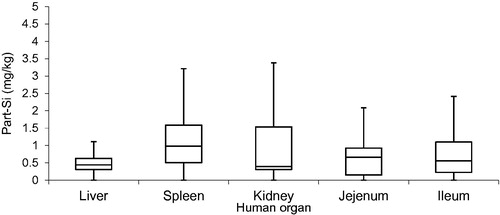
Figure 5. Number-based particle size distribution for SiO2 particles found in tissues of human organs. Particles can consist of primary particles, aggregates or agglomerates.
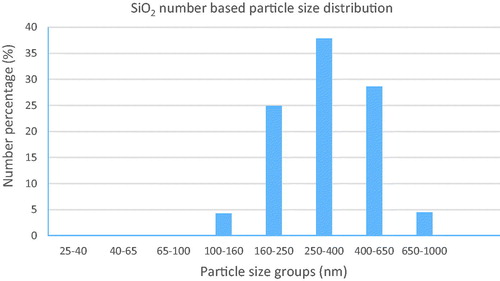
Table 2. Summary of particle SiO2 and TiO2 concentrations in the organs.
Figure 6. Box and whisker plots of the TiO2 particle concentration in human (post mortem) organs. The boxes represent the upper 25% quartile (Q3), median (Q2), and lower 25% quartile (Q1) concentrations respectively. The whiskers indicate 1.5IQR (Q3–Q1).
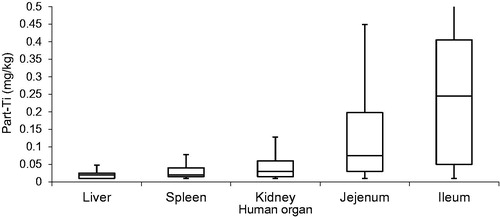
Figure 7. Number-based particle size distribution for TiO2 particles found in tissues of human organs. Particles can consist of primary particles, aggregates or agglomerates.
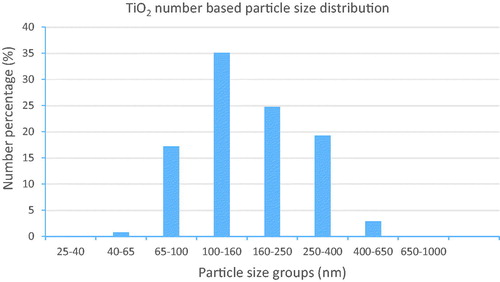
Figure 8. SEM characterization of detected particles detected in a dried liver sample. In addition to the elements indicated in the picture, oxygen was also measured but not shown in the picture. The SEM image on the left shows TiO2 and SiO2 particles as well as aluminum silicate and iron particles. The images on the right show a TiO2 particle (top) and a SiO2 particle (bottom).
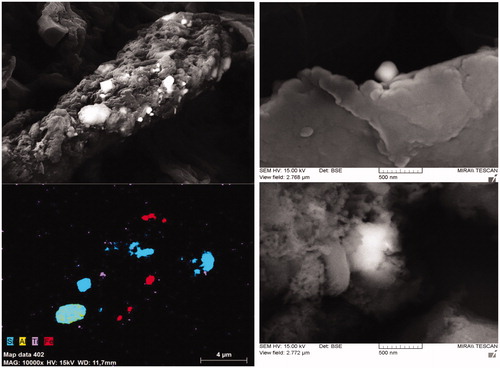
Table 3. Literature data of total-Si and -Ti concentrations in human liver and spleen.