
Figures & data
Figure 1. DNA tail intensity (%) of jejunum samples from animals orally administered the vehicle (CTRL), the positive control MMS (100 mg/kg b.w.) or SAS particles and sacrificed at day 6 (A) or day 26 (B). LD: Low dose (100 mg/kg b.w). HD: High dose (1000 mg/kg b.w.). All values are means ± SEM (n = 6). (*) p < 0.05, one-way ANOVA followed by Dunnett’s test (SAS exposed groups vs. control vehicle group) or Mann–Whitney U-test (MMS vs. control vehicle group).
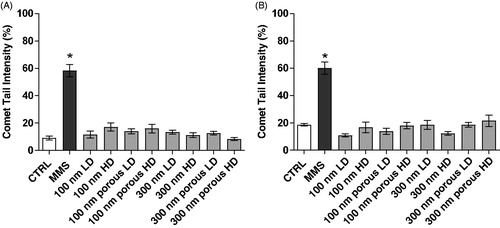
Table 1. Frequency of micronucleated cells [MNCs, mean (SD)] in 2000 normochromatic (NCEs) and polychromatic (PCEs) peripheral blood erythrocytes of vehicle [0.2% (w/v) CMC + 1% (v/v) Tween80 in MilliQ water], methylated (Me) non-porous (100 and 300 nm) and methylated porous (100 and 300 nm) SAS-treated and methyl methanesulfonate (MMS)-treated mice.
Figure 2. TNF-α levels in jejunal mucosa from animals orally administered the vehicle (CTRL) or SAS particles and sacrificed at day 6 (A) or day 26 (B). LD: Low dose (100 mg/kg b.w). HD: High dose (1000 mg/kg b.w.). All values are means ± SEM (n = 6). No statistically significant differences (p< 0.05) were observed by means of one-way ANOVA followed by Dunnett’s test .
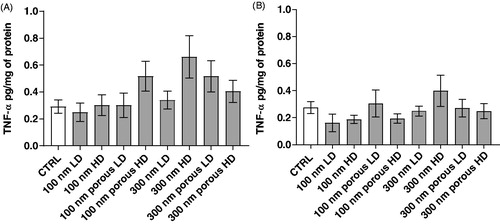
Figure 3. Microscopy image from a jejunum section of a swiss female mouse treated with 1000 mg/kg b.w. 100 nm non-porous SAS. (B) Magnification of the image (A) white contour square area. (C) Image obtained with hyperspectral imaging microscopy from the same field of a consecutive jejunum section of image (A). Colored pixels indicate a spectral match with the RSL for 100 nm non-porous SAS. (D) Magnification of the image C white contour square area.
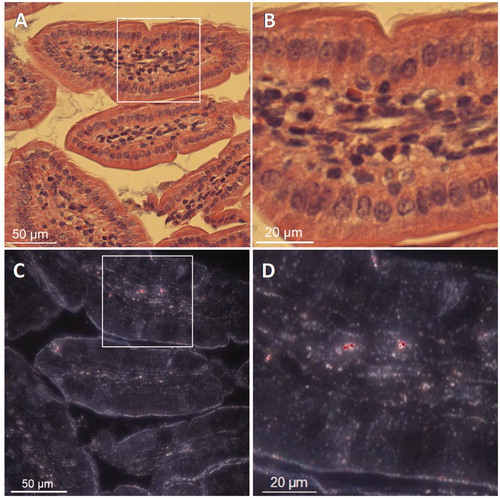
Figure 4. Percentage of matching pixels within the specified the tissue area of control and treated animals. HD: High dose (1000 mg/kg b.w.). All values are means + SEM (n = 7). Mann–Whitney U-test (**) p < 0.01.
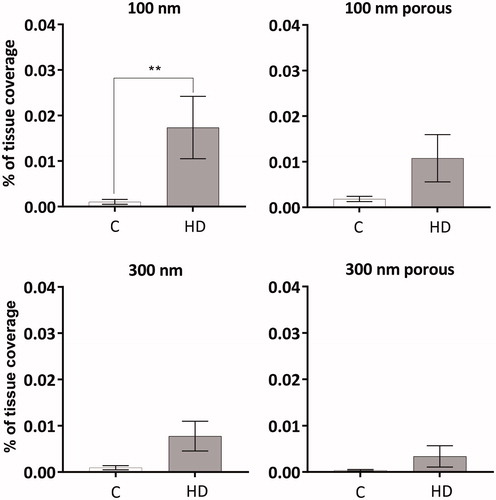
Figure 5. Comparison of two material specific reference spectral libraries: obtained from a treated mouse or from the SAS stock dispersion. The hyperspectral microscopy images correspond to a jejunum section of a mouse treated with 1000 mg/kg b.w. 100 nm porous SAS from the follow-up group (26 days). (B) and (C) are magnifications of image (A) white contour square area, analyzed using a RSL obtained from jejunum sections of a treated mouse (B) or using a RSL obtained from the stock SAS dispersion (C).
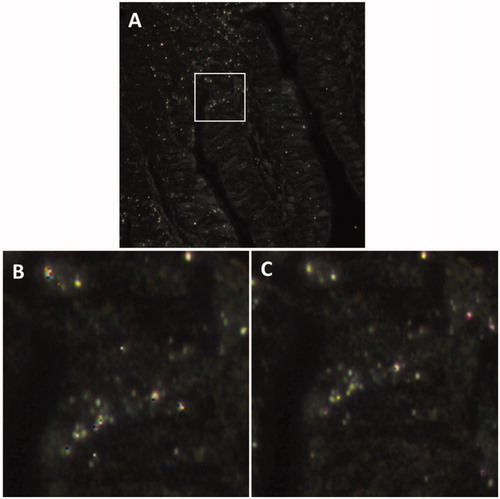
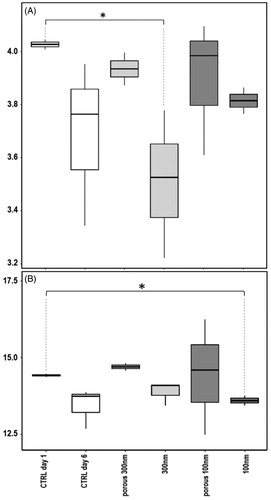
Figure 6. Box-plots illustrating (A) Shannon diversity index and (B) phylogenetic diversity prior to the first administration and at day 6 for controls and SAS-treated groups. Median values and interquartile ranges have been indicated in the plots. Kruskal–Wallis pairwise test, (*) denotes p < 0.05.
TNAN-2020-OR-0197-File002.docx
Download MS Word (32.1 MB)Data availability statement
The data that support the findings of this study are mostly available within its supplementary materials. Any further data are available from the corresponding author [GJ], upon reasonable request.