Figures & data
Figure 1. (a) Particle number size distributions of the aerosolized ZnO NPs, measured with the SMPS and the APS (left axis), and the extrapolated deposition efficiency in the NACIVT system from Jeannet et al. (Citation2015) (right axis), and (b) calculated corresponding deposited mass dose size distributions.
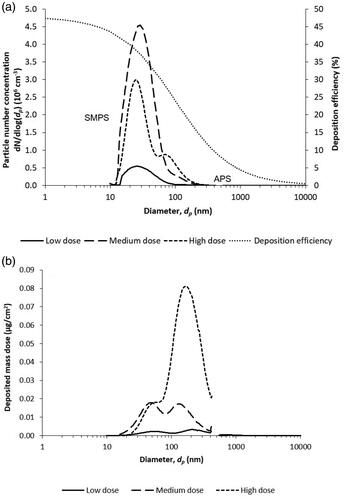
Figure 2. SEM-images of aerosolized ZnO NP deposited on Si wafers in the NACIVT system. (a) Medium dose (x600 magnification), (b) high dose (x600 magnification), (c) medium dose (x50,000 magnification), and (d) high dose (x50,000 magnification).
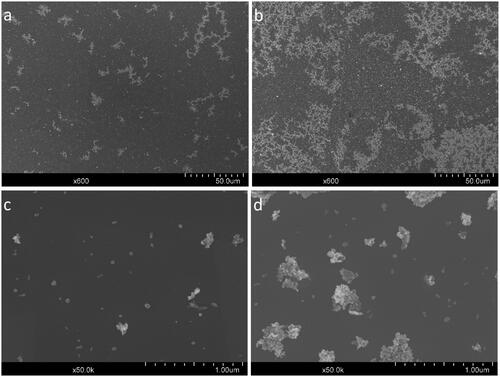
Table 1. Description of experiments in the three exposure systems NACIVT, SUB(iso) and SUB(growth).
Table 2. Exposure parameters in the three exposure systems NACIVT, SUB(iso) and SUB(growth).
Figure 3. Comparison of toxicological responses after ZnO NP exposures in the three different exposure systems NACIVT, SUB(iso) and SUB(growth) 24 h after exposure. a) Metabolic activity measured with the WST-1 assay, b) IL-8 release measured in basal medium with Multiplexed Luminex, and c) MCP-1 release measured in basal medium with Multiplexed Luminex. The WST-1, IL-8 and MCP-1 results were normalized to the unexposed controls. The symbol (*) indicates significant difference from unexposed control levels at p < 0.05 and (**) at p < 0.01. The symbol (#) indicates significant difference between exposure systems at p < 0.05 and (# #) at p < 0.01. The doses corresponded to 0.5, 0.6 and 0.2 µg/cm2 (low), 0.9, 1.1 and 1.0 µg/cm2 (medium), and 4.5, 4.2 and 3.0 µg/cm2 (high) for SUB(growth), SUB(iso) and NACIVT respectively.
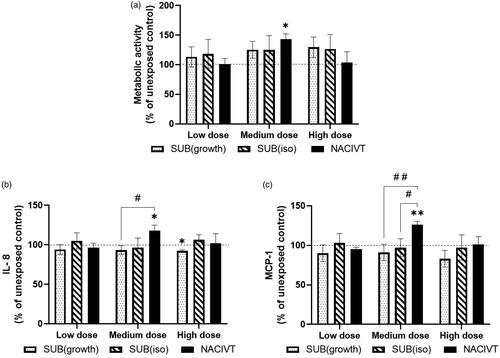
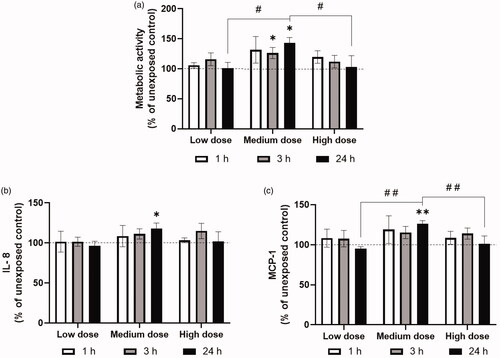
Figure 4. Toxicological responses measured after ZnO NP exposures in the NACIVT system at three different time points after exposure. a) Metabolic activity measured with the WST-1 assay, b) IL-8 release measured in basal medium with Multiplexed Luminex, and c) MCP-1 release measured in basal medium with Multiplexed Luminex. The WST-1, IL-8 and MCP-1 results were normalized to the unexposed controls. The symbol (*) indicates significant difference from unexposed control levels at p < 0.05 and (**) at p < 0.01. The symbol (#) indicates significant difference between different doses at 24 h after exposure at p < 0.05 and (# #) at p < 0.01. The doses corresponded to 0.2 (low), 1.0 (medium), and 3.0 µg/cm2 (high).