
Figures & data
Figure 1. z-average sizes (a,c) and SPR bands (b,d) of initially prepared Au-PEI25kB and Au-PEG5k-OMe (black circles), and 1-year-aged (shelf-life) Au-PEI25kB and Au-PEG5k-OMe (red dots) obtained from DLS and UV-Vis measurements, respectively. Colloidal stability of Au-PEI25kB (e) and Au-PEG5k-OMe (f) in FETAX media by measuring SPR bands (UV-Vis) over 96 h. Insets in panel (e,f) are representing no morphological changes over time (left; 0h, middle; after 48 h, right: after 96 h) for both AuNPs.
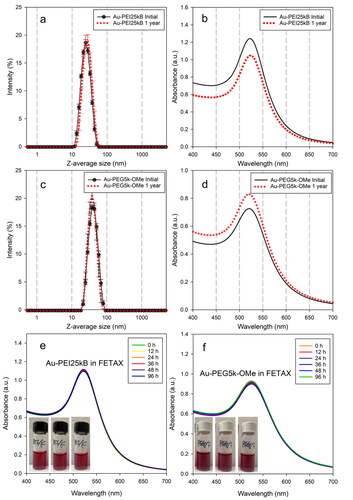
Figure 2. Representative cell toxicity data. The MTS assay results showing viability of (a) CHO-K1, (b) HeLa, and (c) A549 cell line after 24 h exposure to Au-PEI25kB (black), Au-PEG5k-OMe (green), and CdSO4 (pink, used as a positive control). The insets indicate the expanded range of low concentrations used to treat cells from (0 to 50) µmol/L.
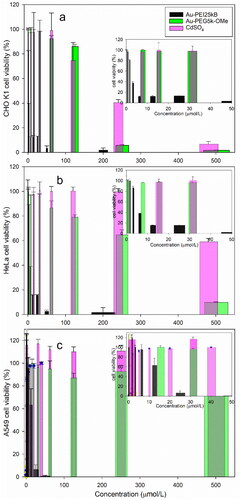
Table 1. 50% lethality (LD50, µmol/L) of tested materials in CHO-K1, HeLa, and A549 cells after 24 h.
Figure 3. Comparative mammalian cell survival chart corresponding to various concentrations (0.–100 µmol/L) of Au-PEG5k-OMe and Au-PEI25kB. Chinese hamster ovary cells ((a,b); CHO-K1), human cerebral microvascular endothelial cells ((c,d); hCMEC), and mouse brain endothelial cells ((e,f); bEnd3) were tested. Notably the cell growth did not decrease with Au-PEG5k-OMe treatment compared to the no-treatment control (three left panels), whereas the Au-PEI25kB-treated cells exhibited significantly compromised growth (three right panels). Error bars indicate one standard deviation.
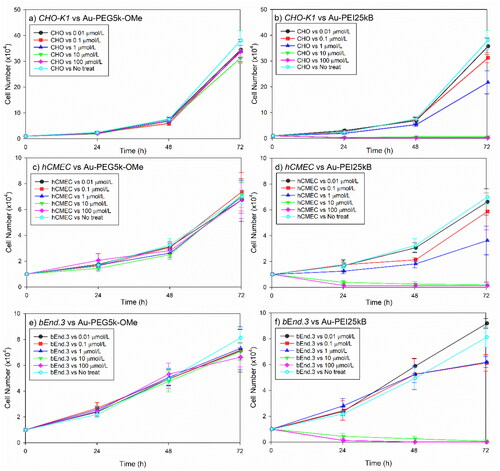
Figure 4. Range determination experiment. Top left corner: Temporal morphology Xenopus laevis embryo after treatment with serially diluted Au-PEI25kB, PEI alone, Au-PEG5k-OMe, PEG alone, and no treatment. (a) The Au-PEG5k-OMe 96 h post-fertilization (hpf) panel shows the embryos at stage 45, prior to anesthesia/euthanasia/fixation, which were washed once with 1x FETAX medium, and subsequently anesthetized to evaluate hemorrhage. Note the lighter wine color of the medium after transferring the embryos to the null-FETAX medium (+MS222). All scale bars: 1 mm. (b) Examples of malformations, including eye defects, bent axes, edema (head, heart, and abdomen), miscoiled intestines (with a spectrum of mild to severe cases), and monsters (with no clear head or axis structure). The malformations shown are the counted features in c (also in ). All scale bars: 1 mm. (c) Concentration-dependent survival and malformation rates. The values indicate the mean and standard deviation. (I) Range-determining test (96 hpf) results obtained using 20 embryos per group, and the tests were repeated three times. Notably, no survival was observed at 13 and 384 µmol/L of Au-PEI and PEI, respectively. (II) Definitive FETAX results. One-way ANOVA (nonparametric Kruskal–Wallis test) test. (i) p = 0.0049, (ii) p = 0.0032, (iii) p < 0.0001, and (iv) p < 0.0001. Kolmogorov–Smirnov test (t-test; nonparametric) for (v) p > 0.99, (vi) p = 0.10, (vii) p > 0.99, (viii) p = 0.10 significant (alpha = 0.05)? Kolmogorov–Smirnov results: (v) D = 0.33, (vi) D = 1.00, (vii) D = 0.33, and (viii) D = 1.00. None of the results are significant at the p < 0.05 level.
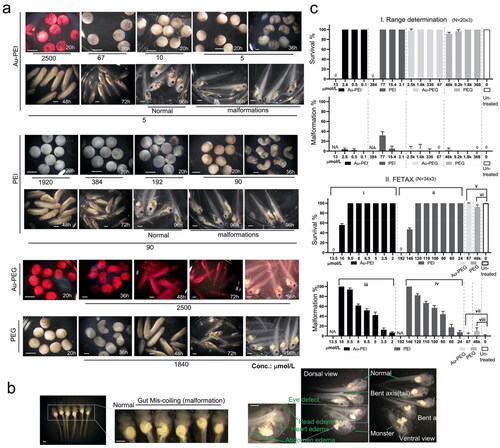
Table 2. Survival and malformation of stage 45 embryos 96 h post-treatment with the compounds.
Table 3. Median lethal concentration (96 hpf LC50) and median effective (teratogenic (TC50)) concentration (96 hpf EC50) calculated using 4PL.
Figure 5. (a) Au-PEI with avidity for the jelly coat. The panels show the embryos treated with Au-PEG5k-OMe or Au-PEI25kB. One-day-used FETAX medium with high-concentration Au-PEI25kB (336 µmol/L) became cleared (asterisk; compare with Au-PEG5k-OMe particles) because the colloidal Au-PEI25kB, unlike Au-PEG5k-OMe, had been bound/trapped/concentrated in the jelly coats (green arrowheads) of the dead embryos. The squared regions in the first columns of the panels are magnified in the second columns. Also, at a lower concentration (67 µmol/L) of Au-PEI, although the medium has much lighter wine color (more perceivable in the same concentration Au-PEG group), the embryos suffered complete lethality and had dark red surface within 24 h (green arrowheads) indicating the Au-PEI attraction to jelly coat occurred within 24 h post-treatment. Larvae in this dish did not become darker red when seen at the 48 h indicating further attraction of the AuNPs to the jelly coat, and that the jelly layer was saturated with NPs or no more AuNPs were left in the medium. When treated with 10 µmol/L Au-PEI25kB, the embryo jelly coat (pink arrowheads) absorbed AuNPs in the layer, and turned red, whereas the jelly coat of the Au-PEG5k-OMe group remained transparent no color in obvious contrast. During the hatching period (48 h), the VE (yellow arrowheads)/jelly (pink arrowheads), double-layer coat peels off the larvae tethering on the cement gland of the tail bud embryo, which shows an obvious red color with Au-PEI25kB, but not with Au-PEG5k-OMe, indicating that the colored layer is not the larval surface, but the envelope and coat. Scale bars: 1 mm. (b) De-jellied embryos. A large filtration effect of the jelly layer on Au-PEI was observed. The FETAX method included L-cysteine treatment that removed the jelly coat but left the VE intact. Au-PEI25kB (1600 µmol/L) attached to the bottom of the plastic dish from which dead embryos were removed at 24 h. Note the ring-shaped dense red stains surrounding the embryos. These polystyrene-attached AuNPs were not observed with Au-PEG5k-OMe (data not shown). Instead, at 40 h, as the tail bud larvae became longer and curled inside the VE, a space developed between the VE and embryonic body, and a red color-free area was observable in this space, indicating that Au-PEG5k-OMe cannot undergo simple diffusion through the VE. The hatched embryos do not have this space. The absence of red stain condensation along the edge of this space indicated little or no attachment of Au-PEG5k-OMe onto the VE. Hatched embryos (blue arrowheads, with burst VE); pre-hatching embryos (yellow arrowheads, intact VE). Scale bars: 1 mm. (c) Line pixel assessment of 24 h old embryos treated with Au-PE25kB or Au-PEG5k-OMe following de-jellying. Left four panels: Photographs showing embryos treated with 1600 µmol/L and 336 µmol/L of Au-PEI25kB and Au-PEG5k-OMe, respectively, with a crossing line drawn on top. Using Zen blue 3.1 software (Zeiss), color intensities of pixels on the embryo-crossing line were measured. Right panels: intensity charts for the four separate colors. Note that the edges of the Au-PEI25kB-treated embryo boundaries exhibited more intense red pixels, whereas the centers of the Au-PEG5k-OMe-treated embryo boundaries included stronger red pixels than the edges (circles). This indicated that Au-PEI25kB accumulated on the VE, whereas Au-Au-PEG does not. (d) TEM results of mid-blastula embryos treated with a high concentration (1600 µmol/L) of Au-PEI25kB or Au-PEG5k-OMe. Note that these embryos lacked the VE. Four-hour treatment with AuNPs. First column: 5000× (low magnification), and the second and third columns: 20000× (high magnification). Zoomed-in images of the two square regions (i,ii) in the first column panels. Arrowheads: AuNPs observed in the images. Note: Au-PEI25kBs were observed along the plasma membrane (first row panels). Au-PEG5k-OMes were observed in the cytoplasm. (e) Scatter plot of the AuNP location frequency. Each dot represents a scanned TEM image wherein the intracellular area and membrane length were measured, and the number of AuNPs was counted. The counted number of AuNPs were divided by the area or length (arbitrary value by Image J), and then multiplied with 1000× (chart ii) or 100 (chart i) to decrease the decimal number, which is represented here as a single dot. A nonparametric t-test was performed for a small number of samples. Kolmogorov–Smirnov D test results: **: p = 0.0016, Kolmogorov–Smirnov D = 1.000, (the results are significantly different at the p < 0.05 level); ns: not significant, p = 0.1203, Kolmogorov–Smirnov D = 0.5250 (the results are not significantly different at the p < 0.05 level). Notably, the sum of the arbitrary lengths of the plasma-membrane in all scanned images was 64.351 for Au-PEI25kB and 31.764 for Au-PEG5k-OMe. However, the numbers of peri-extra-membranous AuNPs were 466 and 2, respectively, indicating higher probability of the extracellular lining of Au-PEI25kB on the plasma membrane, whereas a very low chance was observed for Au-PEG5k-OMe.
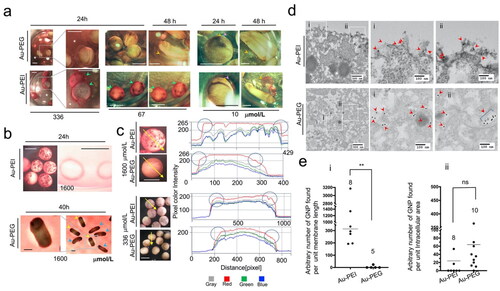
Figure 6. (a) Inj-FETAX. Morphology of the AuNP-injected embryos. Upper 6 panels: Au-PEI-injected embryos, showing lethality/malformation at high to low doses when examined at 96 post-fertilization (hpf). Lower 2 panels: Au-PEG5k-OMe-injected embryos exhibited no lethality even at the highest dose (150 µmol/L). In contrast, less than half of the maximum dose (60 µmol/L) of Au-PEI25kB caused more than 50% lethality. The injection volume limit permitted the injection of a maximum dose of 150 µmol/L (shown in (a) Au-PEG5k-OMe; left bottom panel). Notably, this concentration was rather high, as the wine-colored Au-PEG dispersed in the head, thorax, and tail was visible through the semi-transparent body. Even surprisingly, eight out of ten embryos with extreme dose (600 µmol/L; 40nL injection) in over-testable volume showed no obvious defect. (b) Survival and malformation rate chart. FETAX was performed three times independently, with 20 embryos comprising each group. FETAX m.: injection with FETAX medium alone. Embryos injected with decreasing dose of the Au-PEI25kB but not of the Au-PEG5k-OMe exhibited gradual increasing survival rate and decreasing malformation rate. One-way ANOVA (nonparametric Kruskal–Wallis test) test. (i) p = 0.0049, (ii) p = 0.0032, (iii) p < 0.0001, (iv) p < 0.0001, and (v) p < 0.0001. Kolmogorov–Smirnov test (t-test; nonparametric) for (v) p = 0.10 and (vi) p = 0.10, significant (alpha = 0.05)? Kolmogorov–Smirnov results: (v) D = 1.00 and (vi) D = 1.00. The results are not significant at the p < 0.05.
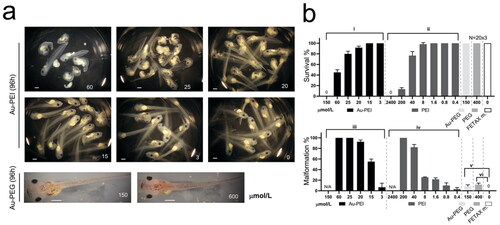
Table 4. Median lethal concentration (96 hpf LC50) and median effective (teratogenic (TC50)) concentration (96 hpf EC50) calculated using 4PL.
Table 5. Survival and malformation of stage 45 embryos 96 h post injection of the compounds.
Supplemental Material
Download MS Word (474.7 KB)Data availability statement
The authors confirm that the data supporting the findings of this study are available within the article [and/or] its supplementary materials.