
Figures & data
Figure 1. Logic model to organise evidence on the impacts of drinks containers on micro- and macro- drinking behaviours, with two proposed mechanisms: perception and affordance.
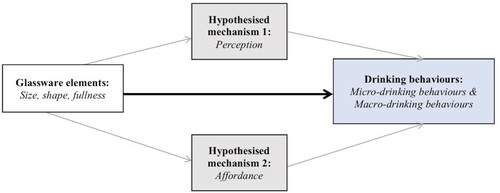
Figure 2. Image to depict the midpoints of 330 ml portions in outward-sloped and straight-sided glasses, as in Langfield et al. (Citation2018) and Langfield et al. (Citation2020).
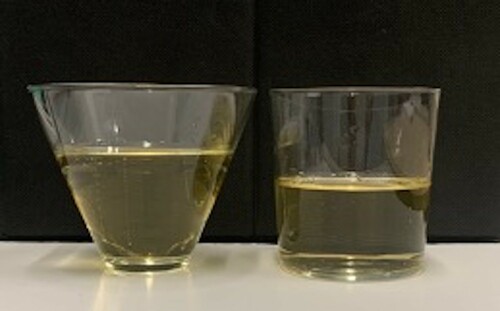
Figure 3. Plots to show affordance by glass shape of volume remaining (%) by angle of tilt. ‘A’ illustrates the relationship with glass dimensions as used by Langfield et al., Citation2018; Study 1 (Langfield et al., Citation2020). ‘B’ illustrates the relationship with more extreme dimensions.
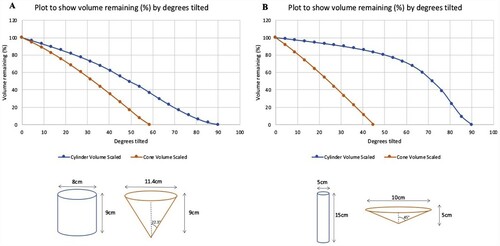
Table 1. Typology of macro- and micro- drinking behaviours.
Supplemental material