Figures & data
Figure 1. PRISMA flow diagram indicating articles retained and excluded at each stage of the screening process (Moher et al., Citation2009).
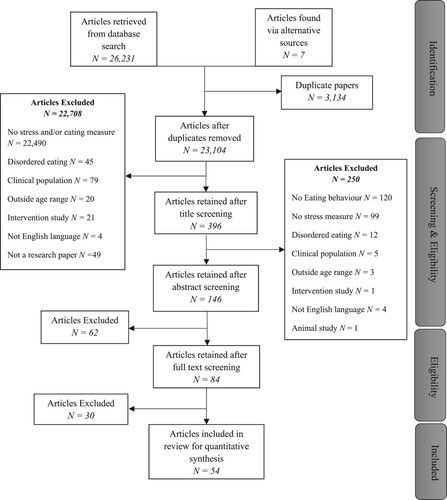
Figure 2. Number of studies scoring across 5 quality assessment sections from weak to strong (left to right).
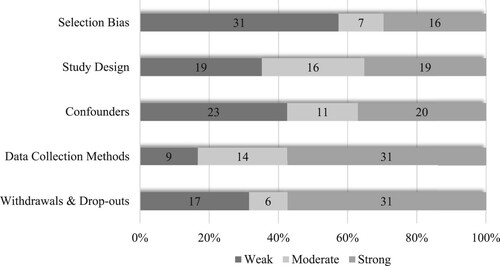
Figure 3. Proportional distribution plot of stress and eating behaviours overall across all studies (k = 54).
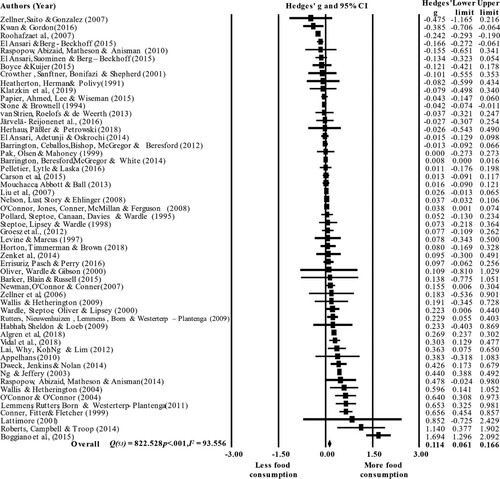
Figure 4. Funnel plot of publication bias with observed (white) and imputed (shaded) studies.
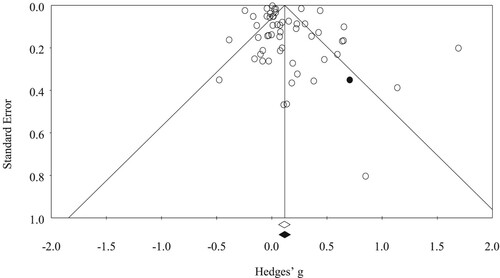
Table 1. Summary of heterogeneity within and between variable analyses in the meta-analysis (k = 54).
Table 2. Summary of findings from meta-regressions on stress and type of food intake.
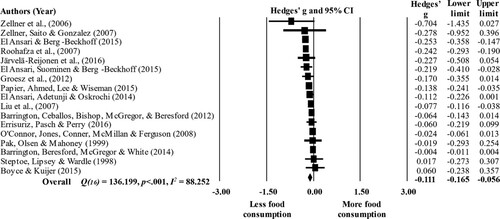
Figure 5. Proportional forest plot of stress and consumption of unhealthy foods (k = 35).
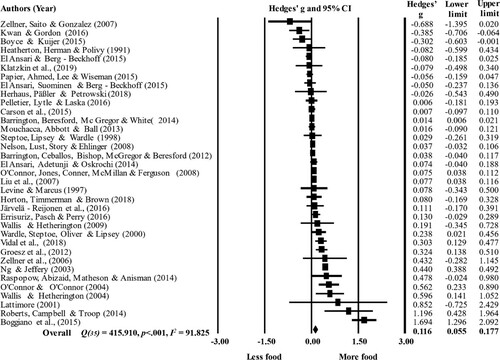
Table 3. Summary of heterogeneity within and between studies on stress and unhealthy (k = 35) and healthy eating behaviours (k = 17).
Figure 6. Proportional forest plot of stress and consumption of healthy foods (k = 17).