Figures & data
Figure 1. Illustration of two ways to examine sitting behavior. Both panels display the same accelerometry data (i.e., data from eight participants, one single day per participant, from waking up to going to bed; names are pseudonyms; data from; Eversdijk et al., Citationin preparation). (a) Total sitting time in hours, summed over all sitting episodes. (b) Sit-to-stand transitions (blue ticks) and stand-to-sit transitions (red ticks) over the course of the day. Together, these plots illustrate that an analysis of total sitting time overlooks important aspects of sitting behavior (e.g., Erin had several very long stretches of uninterrupted sitting; Hans showed many sit-to-stand and stand-to-sit transitions).
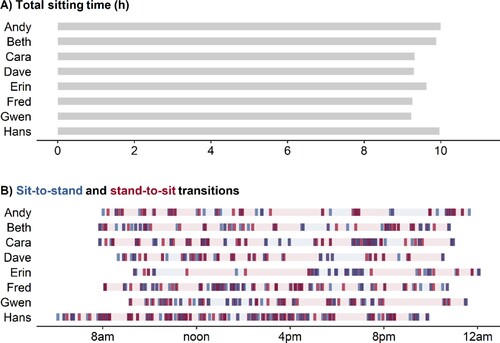
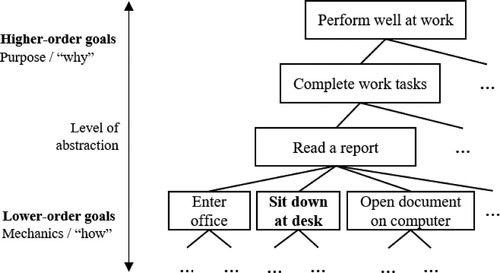
Figure 2. Schematic visualization of a goal hierarchy for the higher goal to perform well at work. The figure illustrates how stand-to-sit transitions are often relatively lower-order behaviors.