
Figures & data
Figure 1. PRISMA flow diagram illustrating the identification, screening and inclusion of studies.
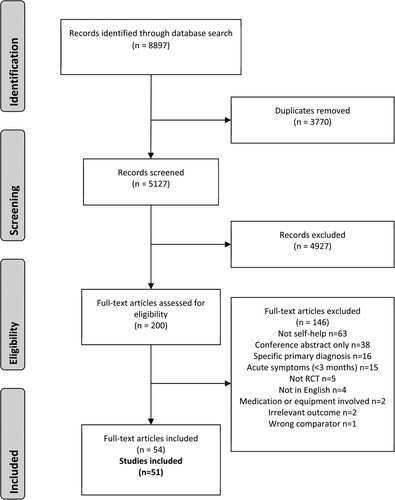
Figure 2. Risk of bias assessment based on five domains and overall bias as defined by the revised Cochrane risk-of-bias tool for randomised trials (n = 51).
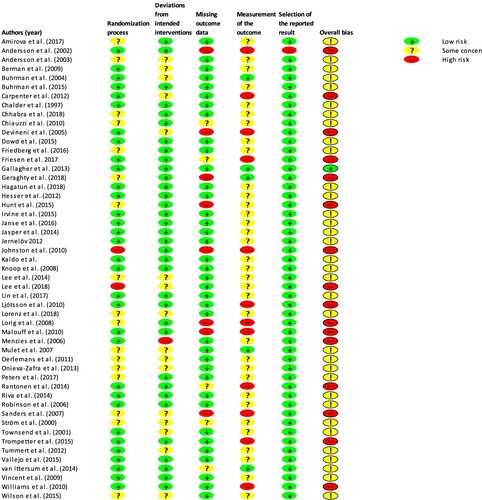
Table 1. Characteristics of included RCTs and intervention descriptions.
Figure 3. Standardised mean difference (95% CI) of the effect of the primary interventions compared with passive control groups on symptom burden at post-treatment (n = 32).a
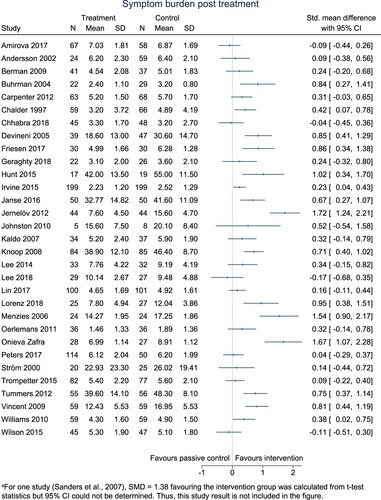
Figure 4. Standardised mean difference (95% CI) of the effect of the primary interventions compared with passive control groups on quality of life at post-treatment (n = 33).
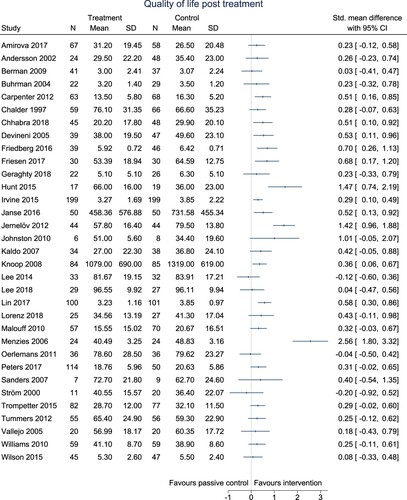
Figure 5. Proportion of studies (95% CI) favouring the intervention (SMD > 0) and proportion of interventions (95% CI) with effect (SMD ≥ 0.2) at post-treatment, ≤3 month follow-up and >3 month follow-up according to risk of bias distribution. SMD = standardised mean difference.
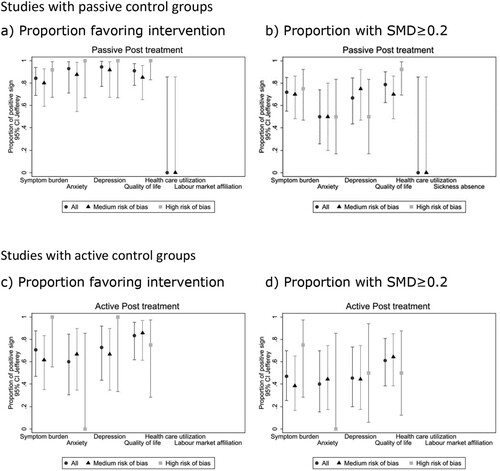
Figure 6. Frequency of behaviour change techniques applied in studies comparing the primary intervention with an active control group (n = 23) and/or a passive control group (n = 38).
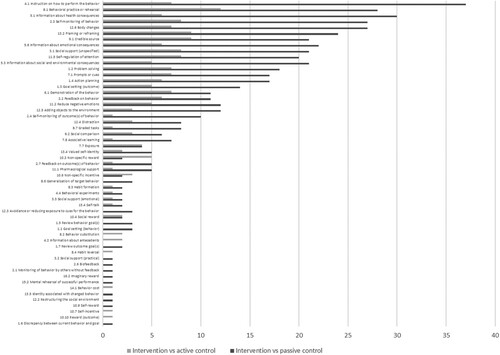
Table 2. Effect (SMD> = 0.2) of interventions and index of potential of BCTs (95% BCI) applied in each symptom cluster in studies with passive control groups (n = 38)a,b,c.
Table 3. Effect (SMD> = 0.2) of interventions and index of potential of BCTs (95% BCI) applied in each symptom cluster in studies with active control groups (n = 21)a,b,c,d.
Table 4. Definitions (Michie & Atkins, Citation2014) and examples of behaviour change techniques with potential effect.
