Figures & data
Figure 1. Prisma diagram illustrating the flow of information through the different phases.
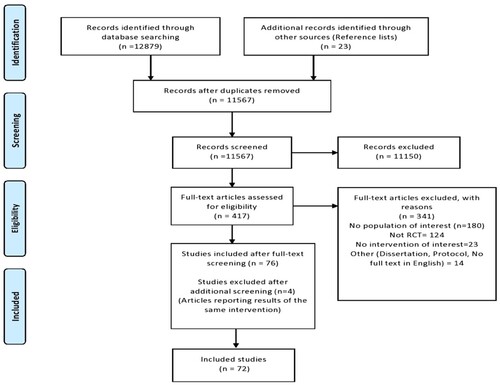
Table 1. Characteristics of included studies.
Figure 2. Presence of single conditions in the 72 studies.
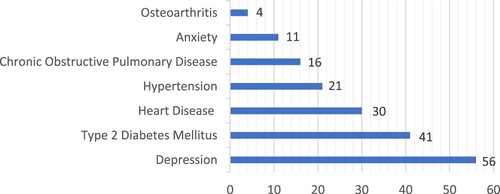
Figure 3. Types of interventions according to the most common clusters of conditions.
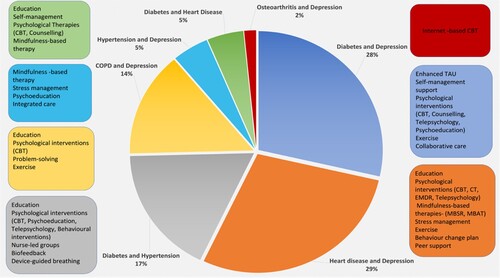
Figure 4. Frequency of primary outcomes.
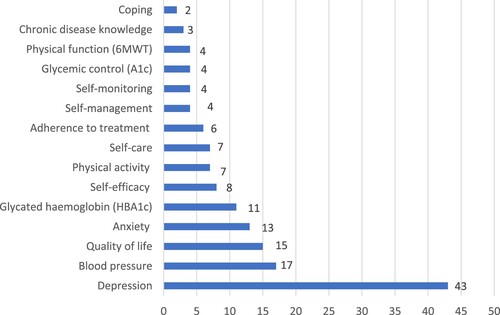
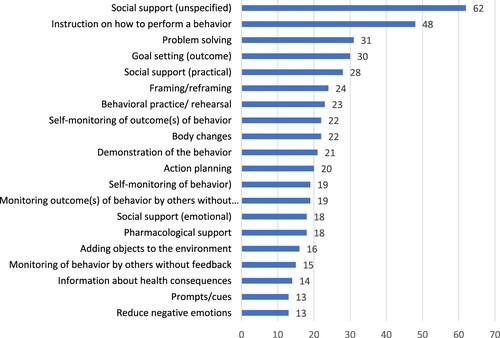
Figure 5. BCTs sorted by frequency.