Figures & data
Table 1. Types of stability and corresponding (linear) multilevel models and assumptions.
Table 2. Mean score and SD for mathematics, split by test.
Table 3. Linear and function stability estimates for mathematics scores.
Table 4. Probability of continuous declines  and under the residual distribution over a number of test administrations.
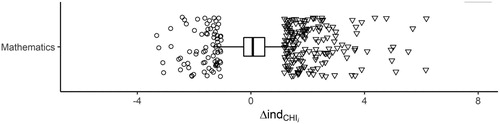
Figure 1 .# Values for language and mathematics. One extreme value (14.12) in mathematics that falls outside the plot range is indicated by a cross and a label.