
Figures & data
Table 1. Completeness of data on selected household variables in Next Steps.
Table 2. Percentage of wave 1 respondents in each successive wave of Next Steps.
Figure 1. Participant dropout and changes in household income over time.
Note: In wave 8, after a gap of 5 years, monetary incentives were offered for dropout cases from the original sample to respond.
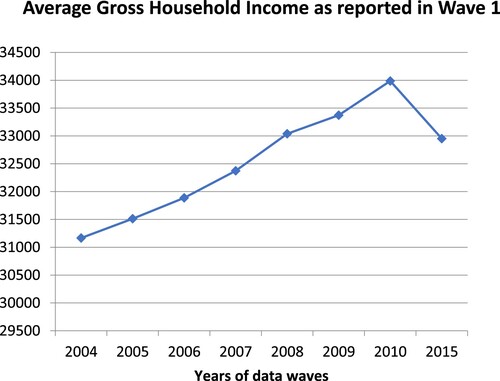
Table 3. Completeness of data on selected individual variables in NPD 2005/06.
Figure 2. Percentage FSM eligibility (NPD) by decreasing household income band (NS).
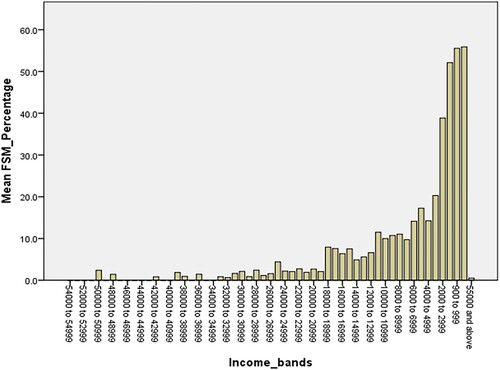
Table 4. Percentage of young people from poor families identified as FSM-eligible (2004).
Table 5. Percentage of young people from poor families identified as FSM-eligible (2005).
Table 6. Summary of the included cases.
Table 7. Correlation between indicators of disadvantage and KS4 attainment.
Table 8. Percentage correctness of predicting KS4 Level 2, based on income and FSM.
Table 9. Coefficient value.