
Figures & data
Table 1. TPACK Component definitions and survey component and item examples. Adapted from Chai et al. (Citation2013).
Table 2. Key national and international literature sources used to develop the survey.
Table 3. Survey components.
Table 4. Item fit statistics for n = 10 items in Component 1, General computing skills (n = 296 respondents). Items marked * were identified as ill-fitting.
Table 5. Component 1, Item summary fit statistics, Separation and Reliability indices for n = 10 items and n = 296 respondents.
Table 6. Component 1, Item summary fit statistics, Separation and Reliability indices for n = 7 items and n = 296 respondents.
Figure 1. All n = 10 Component 1 items displayed in a bubble chart.
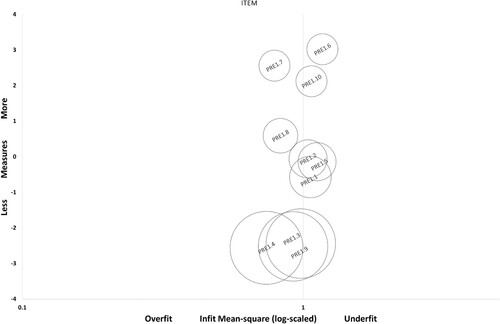
Figure 2 Component 1 items (n = 7) displayed in a bubble chart after the three non-fitting items were removed.
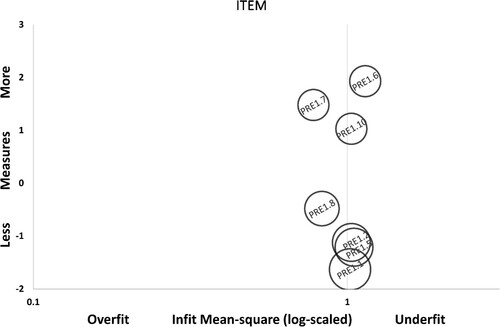
Figure 3. Wright map of Component 1, General computing skills, showing the initial n = 10 items and n = 7 items that fitted the model.
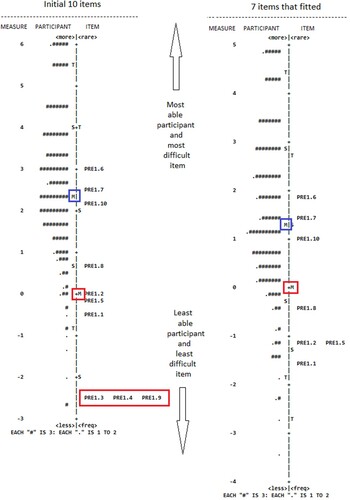
Table 7. Participants’ ability to affirm Component 1, general computing skills (n = 296).
Table 8. Participant and item separation, reliability and fit for survey items within each component after removing n = 23 non-fitting items.
Figure 4. Wright map of all 77 items and 10 components in the instrument.
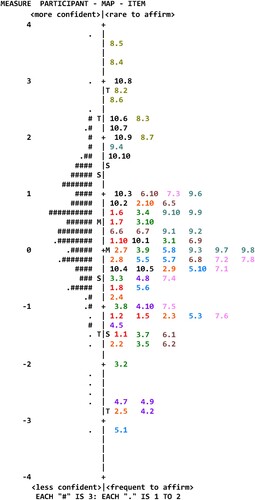
Table 9. Participant and item fit for the 77 items across all components in the instrument.
Table 10. PCA: standardized residual variance for all 77 items.
Table 11. PCA: standardized residual variance for each individual component.
Figure 5. Category probability curves.
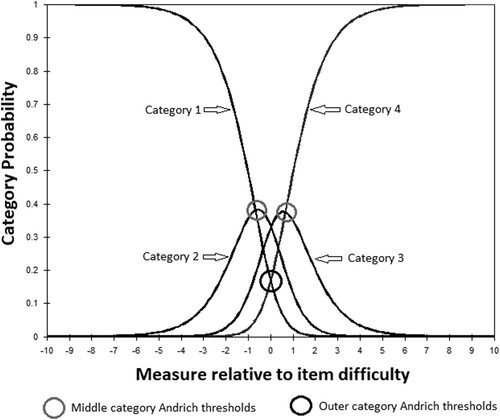
Table 12. Summary of category structure.
Supplemental Material
Download MS Word (85.4 KB)Data availability statement
The data that support the findings of this study are openly available in OSF at: https://osf.io/v5wru/?view_only=335c5e541cef4345b029bc0f9e5ad936