
Figures & data
Figure 1. Study flow diagram.
Table 1. GROW curriculum components, with rankings of importance by students and GROW leaders.
Table 2. Sample sociodemographic characteristics across all data collection time points.
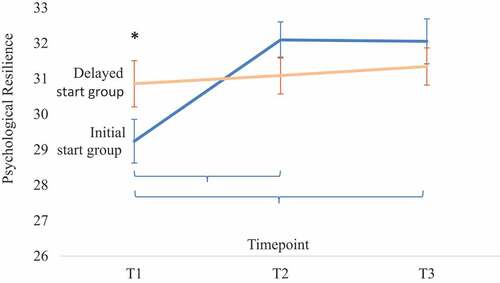
Table 3. Psychological resilience measures: Results from mixed effects modelling comparing the initial start and delayed start groups across three time points.
Figure 2. Changes in psychological resilience.
Supplemental Material
Download MS Word (45.2 KB)Data availability statement
Study data available at https://osf.io/57ft2/ may be accessed by researchers in adolescent resilience, positive youth development, positive psychology, or religiousness/spirituality who work at an institution with a Federal Wide Assurance (U.S.) or equivalent accreditation, and who wish to conduct secondary analysis of the data. Investigators should send an inquiry describing their qualifications, research objectives, and planned analysis of the data to the corresponding author. Requests will be reviewed and approved by an independent third party.