
Figures & data
Figure 1. Explanatory concurrent mixed-methods design employed in this study.
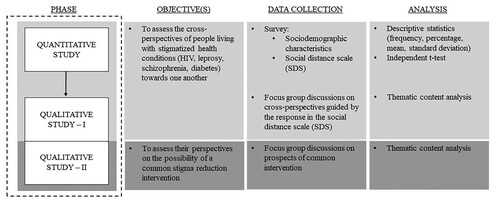
Table 1. Participants’ characteristics (N = 80).
Table 2. Perceived SDS scores across four conditions.
Table 3. Comparison between within-group and across-group SDS scores.
Data availability statement
The data that support the findings of this study are available on request from the corresponding author [SSR], upon reasonable request.