Figures & data
Figure 1. Sketch of a plain dent on pipe surface: (a) dent cross-section; (b) top view. (This figure is available in colour online.)
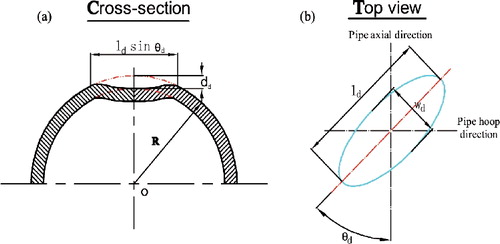
Figure 2. Sketch of dented pipe subjected to pure bending moment.
Figure 3. FEA model of dented pipe: (a) general mesh distribution; (b) refined dent region. (This figure is available in colour online.)
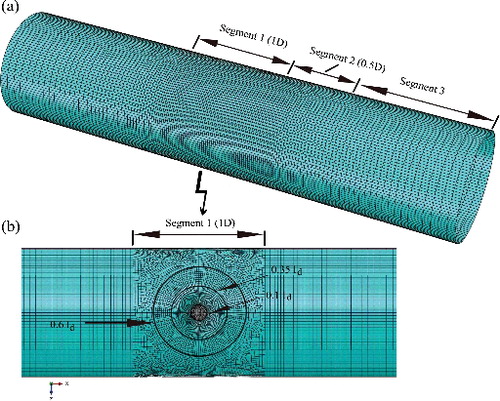
Table 1. Principal dimension of pipe models for simulation.
Figure 4. The fitted true stress-strain curve for numerical investigation. (This figure is available in colour online.)
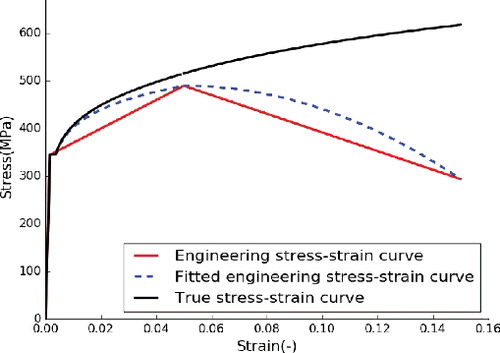
Figure 5. Configuration of four-point bending test set-up in laboratory. (This figure is available in colour online.)

Figure 6. Dent damage from both test and numerical models: (a) artificial dent damage on specimen; (b) dent damage on numerical model. (This figure is available in colour online.)
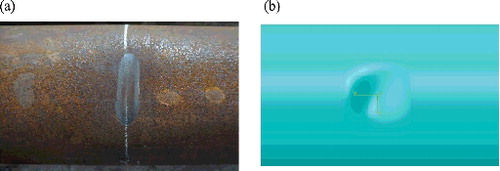
Table 2. Summary of both test and simulation results on dented specimens (dimension unit: mm; angle unit: degree; dents are on the compression side of specimens).
Figure 7. Comparison of failure mode between test and simulation (S2N1). (This figure is available in colour online.)
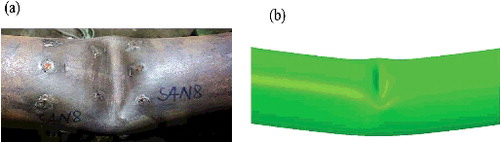
Figure 8. (a) Sketch of representative paths on specimen surface (S2N1); (b) four stages during the loading procedure; (c) strain along the longitudinal path AB; (d) strain along the hoop path CD. (This figure is available in colour online.)
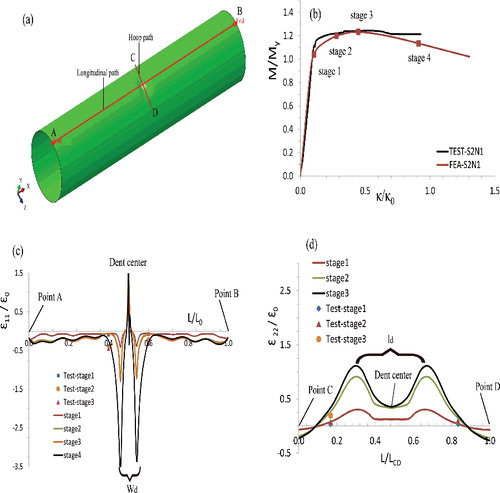
Figure 9. Comparison between numerical and test results in terms of bending moment-curvature diagram for specimens with dent: (a) specimen S2N2 with 90° dent on compression side; (b) specimen S2N3 with 45° dent on compression side; (c) specimen S2N5 with 90° dent on compression side. (This figure is available in colour online.)
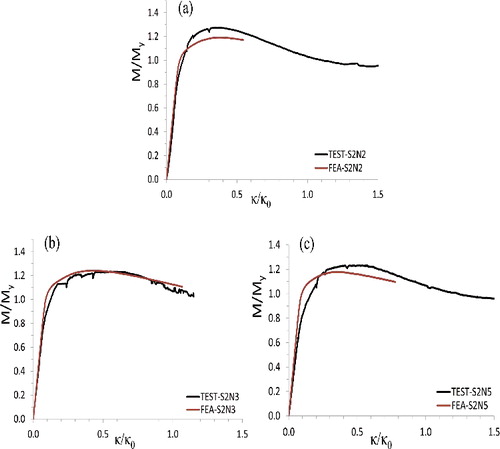
Figure 10. The first eigenvalue-buckling mode of a perfect pipe subjected to pure bending. (This figure is available in colour online.)
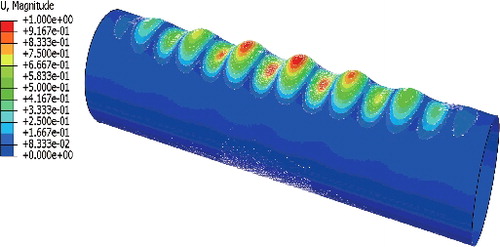
Figure 11. Bending moment-curvature diagram of a pipe with varying of initial imperfection (no dent damage). (This figure is available in colour online.)
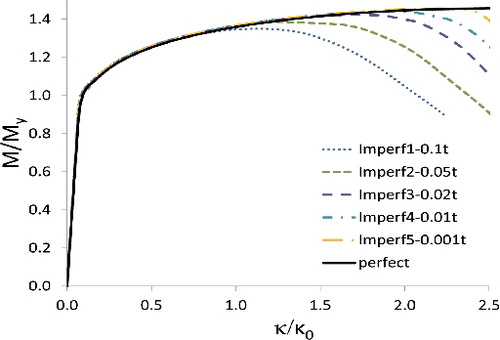
Figure 12. The bending capacity of a dented pipe with varying of D/t. (This figure is available in colour online.)
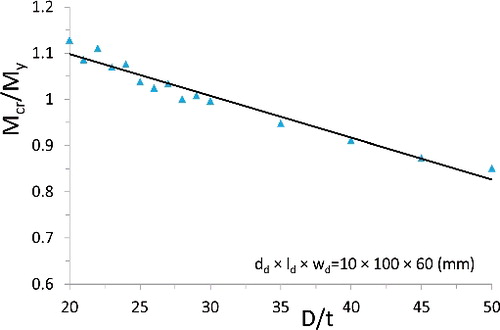
Figure 13. Bending moment-curvature diagram with varied diameter-to-thickness ratio (D/t). (This figure is available in colour online.)
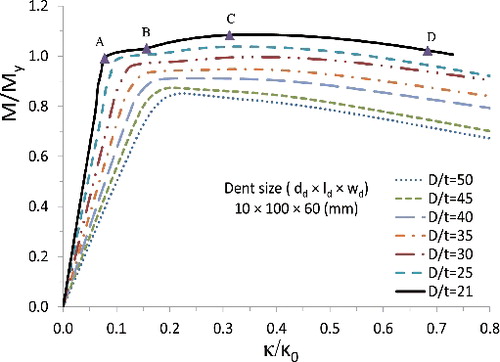
Figure 14. Membrane stress distribution of a dented pipe with different diameter-to-thickness ratio at the ultimate bending point. (This figure is available in colour online.)
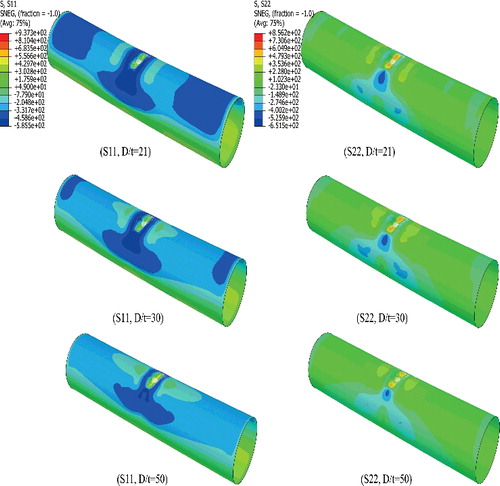
Figure 15. Bending moment-curvature diagram of pipes with varying of the dent location (ld = 100 mm, wd = 60 mm). (This figure is available in colour online.)
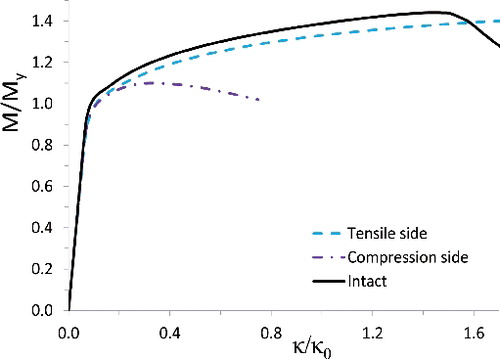
Figure 16. The bending capacity of a dented pipe with varying of dent rotation angle. (This figure is available in colour online.)
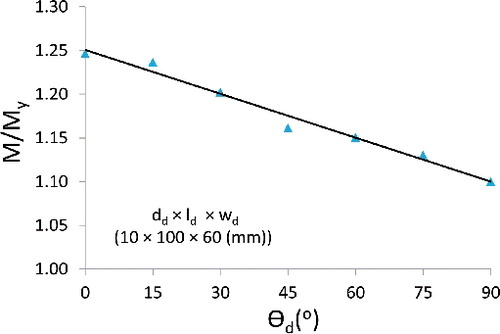
Figure 17. (a) Membrane stress distribution of a dented pipe with dent rotation angle θd = 45° at the ultimate bending point; (b) membrane stress distribution of a dented pipe with dent rotation angle θd = 90° at the ultimate bending point. (This figure is available in color online.)
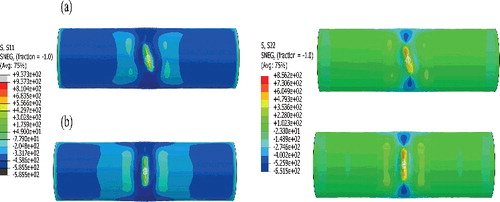
Figure 18. Equivalent plastic strain (PEEQ) of a dented pipe with varying of dent rotation angle (θd) at the ultimate bending point. (This figure is available in color online.)
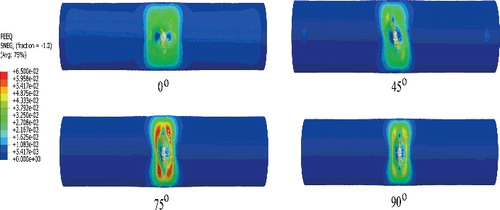
Figure 19. The structural response in terms of bending capacity and maximum lateral displacement of pipe with varying of different parameters: (a) dented pipe with varying of dent depth; (b) dented pipe with varying of dent length; (c) dented pipe with varying of dent width. (This figure is available in colour online.)
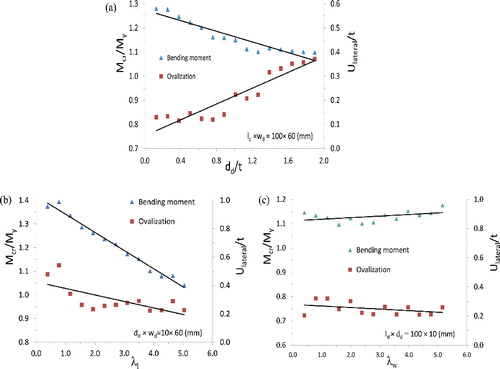
Figure 20. Lateral displacement distribution of a dented pipe with the varied dent depth dd at the residual limit point. (This figure is available in color online.)
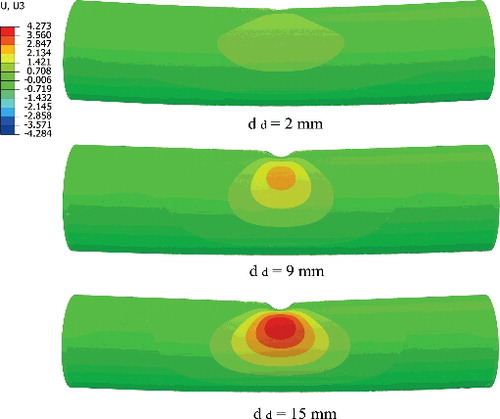
Table 3. Residual ultimate strength of pipes with varying of dent depth.
Table 4. Residual ultimate strength of pipes with varying of dent length.
Table 5. Residual ultimate strength of pipes with varying of dent width.
Figure 21. Comparison of model accuracy: (a) comparison between predictions and both test and simulation results (Mcr/Mi); (b) prediction of strength with varying of dent parameter (λl).