Figures & data
Figure 1. Four interacting fatigue resistance dimensions.
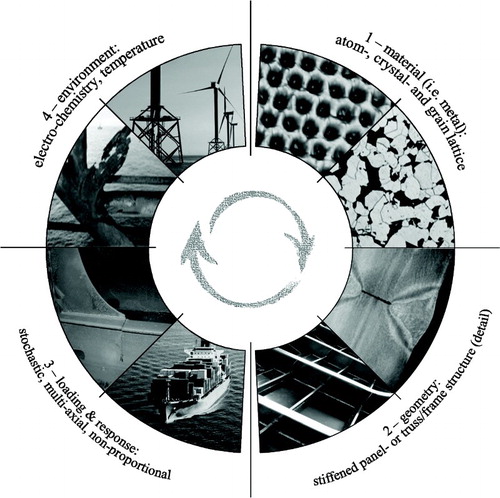
Figure 2. Fatigue physics range of scales.
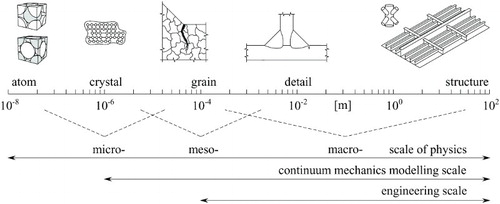
Figure 3. Fatigue damage process.
Figure 4. Fatigue damage criterion overview.
Figure 5. Welded joint normal force and bending moment induced stress distributions.
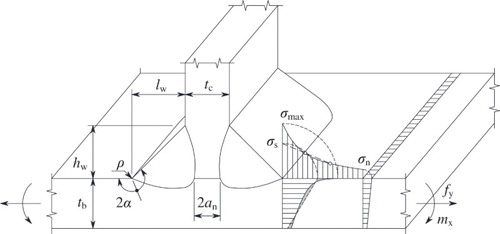
Figure 6. Weld notch process zones.
Figure 7. Anomalous short crack growth at notches.
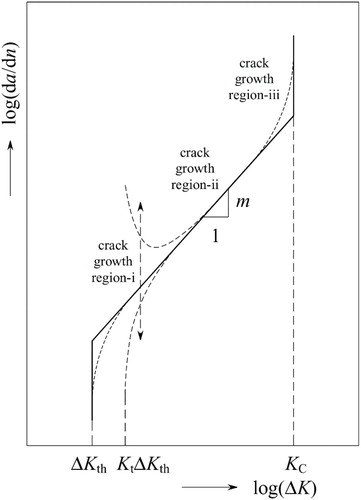
Figure 8. Welded joint fatigue strength similarity.
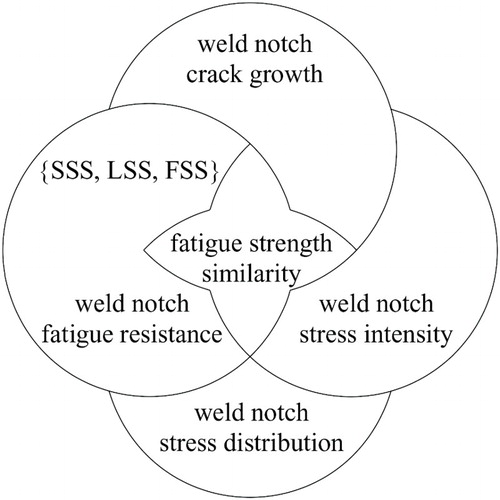
Figure 9. Fatigue damage criterion developments and trends aiming for similarity.
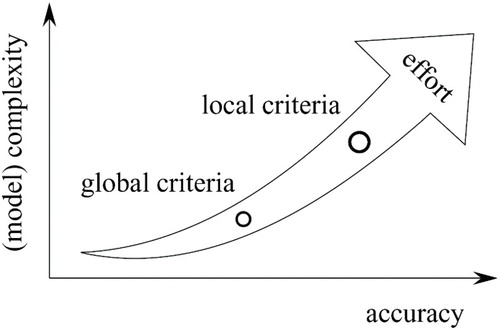
Figure 10. Typical fatigue damage criterion accuracy, complexity and effort relation.