Figures & data
Figure 1. A ship-shaped offshore installation and a shuttle tanker working side-by-side.
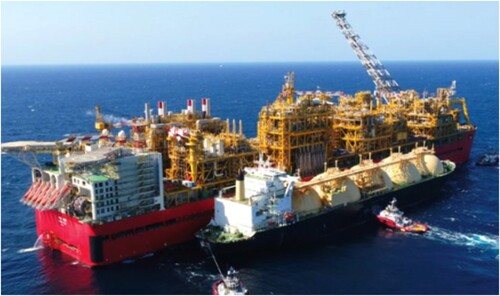
Figure 2. Pneumatic rubber fenders (red ellipses) for absorbing and dampening the impact energy during side-by-side collisions between a ship-shaped offshore installation and a shuttle tanker.
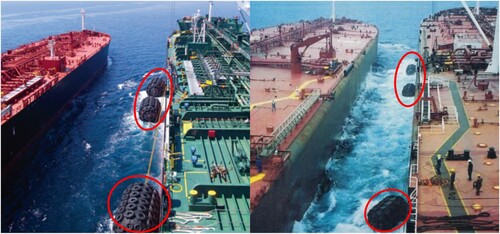
Table 1. Pneumatic rubber fender crushing test conditions.
Figure 3. Structure of a pneumatic rubber fender.
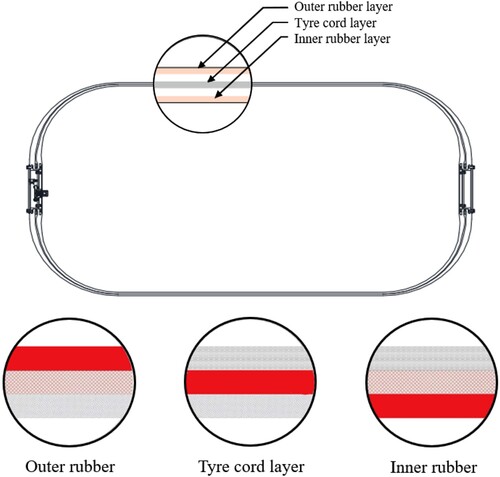
Figure 4. Full-scale pneumatic rubber fender used for the crushing test in this study.
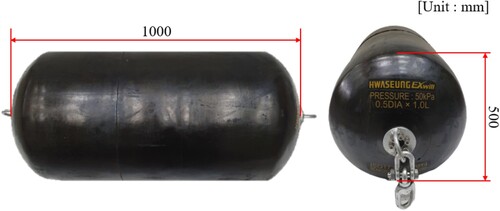
Figure 5. Synthetic tyre cord fabrics forming the middle layer that reinforces the pneumatic rubber fender.

Figure 6. Stress–strain relationship of tyre cords as obtained through tensile testing.
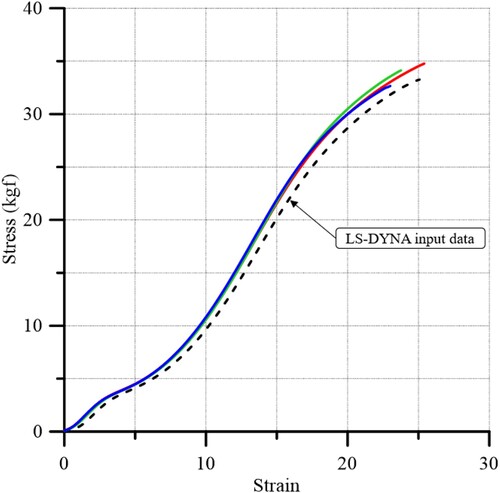
Figure 7. Schematic of the crushing test set-up for the pneumatic rubber fender: (a) elevation view, and (b) plan view
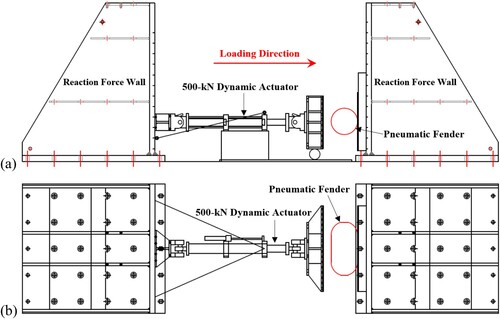
Figure 8. Photograph of the pneumatic rubber fender crushing test equipment.
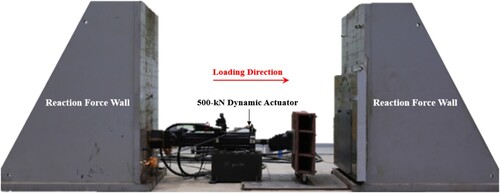
Figure 9. A 500-kN dynamic loading actuator.
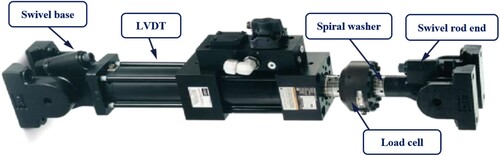
Figure 10. Finite element model of the pneumatic rubber fender developed using four-noded finite elements.
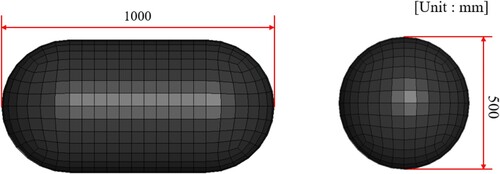
Table 2. Pneumatic fender modelling data input into LS-DYNA.
Table 3. Material properties of the rubber model.
Table 4. Definitions of the contact conditions.
Figure 11. LS-DYNA modelling of the internal pressure in the pneumatic rubber fender.
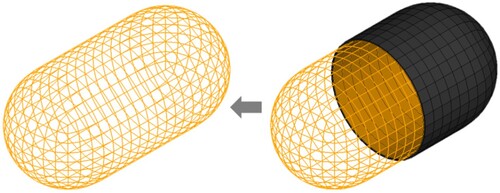
Figure 12. Finite element model of the entire test set-up.
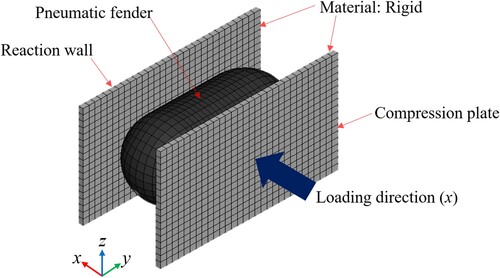
Figure 13. Result of the convergence study to determine the optimum mesh size.
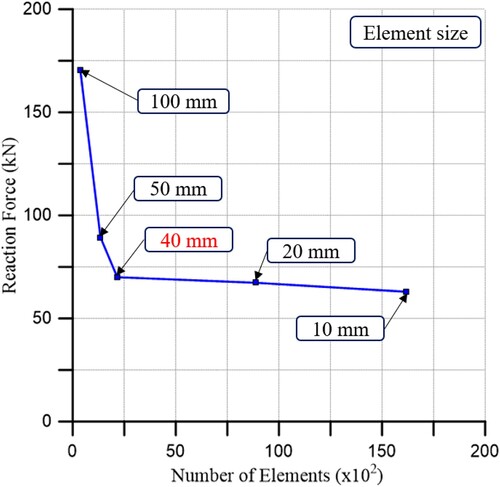
Figure 14. Crushing shapes in the (a) physical test and (b) proposed model.
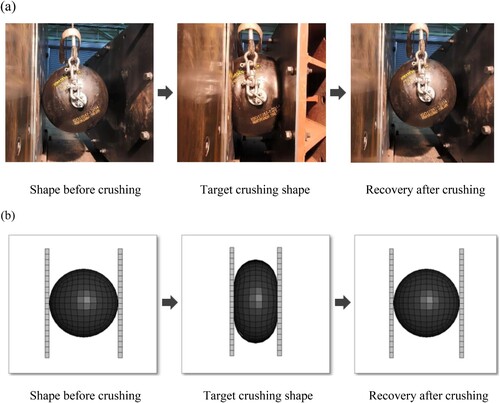
Figure 15. Reaction force–penetration relationship measured in the physical tests.
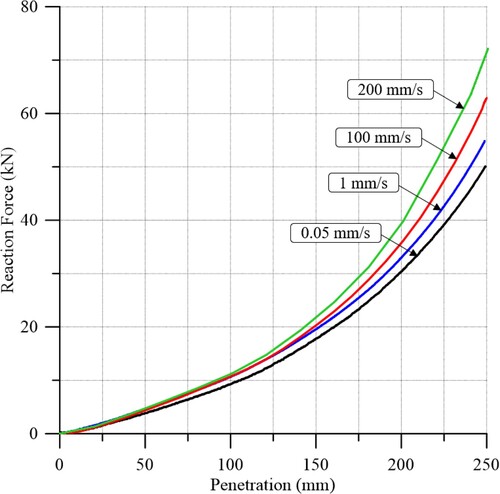
Figure 16. Absorbed energy–penetration relationship measured in the physical tests.
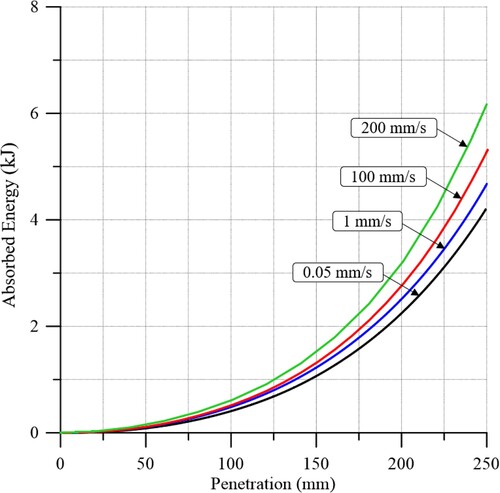
Figure 17. Reaction force–penetration relationship simulated by the proposed model.
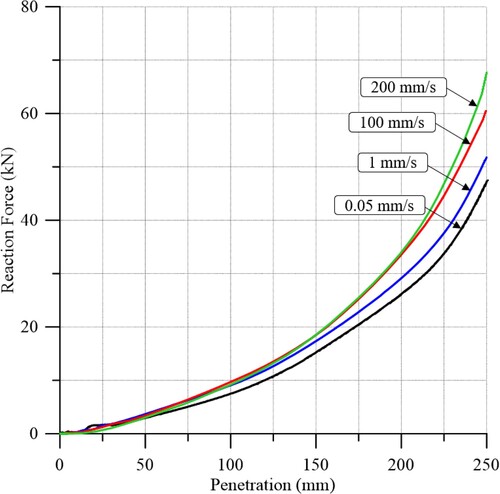
Figure 18. Absorbed energy–penetration relationship simulated by the proposed model.
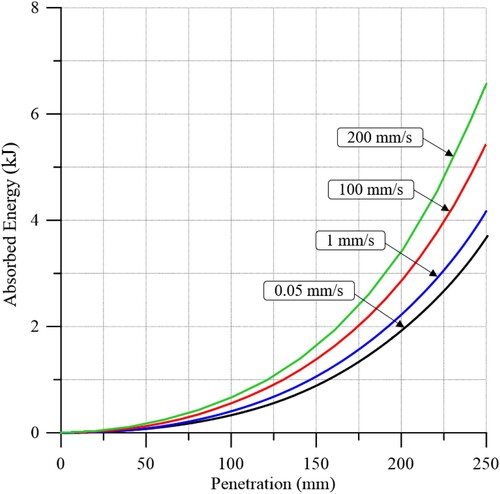
Figure 19. Experimentally measured and numerically modelled absorbed energy–penetration relationships at a loading speed of 0.05 mm/s.
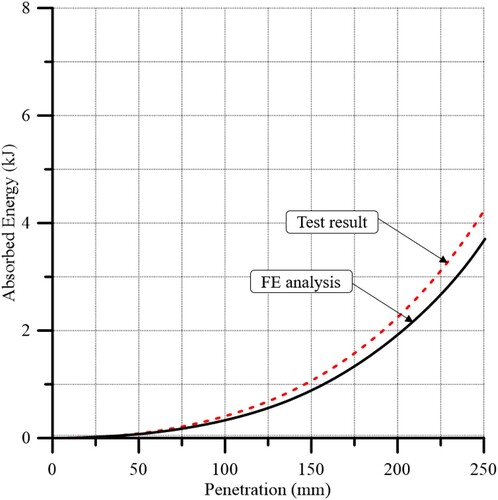
Figure 20. Experimentally measured and numerically modelled absorbed energy–penetration relationships at a loading speed of 1 mm/s.
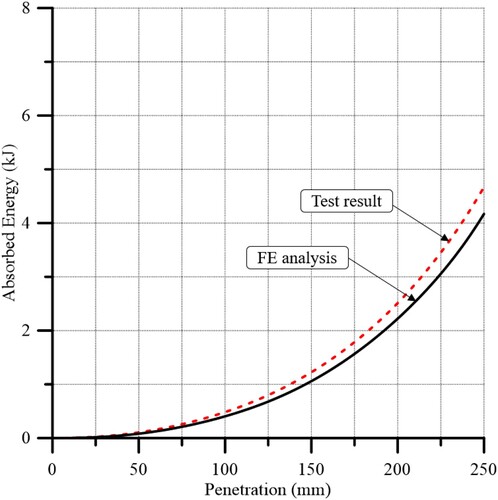
Figure 21. Experimentally measured and numerically modelled absorbed energy–penetration relationships at a loading speed of 100 mm/s.
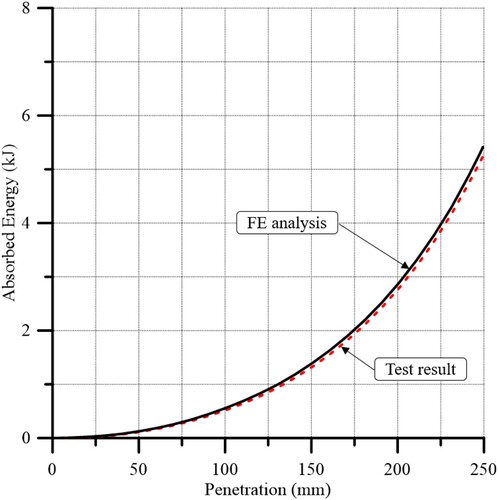
Figure 22. Experimentally measured and numerically modelled absorbed energy–penetration relationships at a loading speed of 200 mm/s.
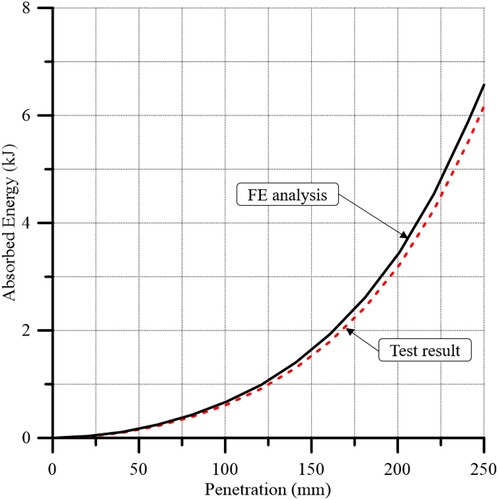
Table 5. Experimentally measured and numerically modelled absorption energy capacities of the pneumatic fender.
Figure 23. Side-by-side collision between an FPSO unit hull and a shuttle tanker.
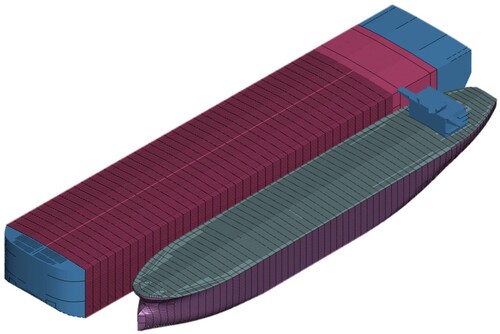
Figure 24. Procedure for determining the recommended size and number of pneumatic rubber fenders.
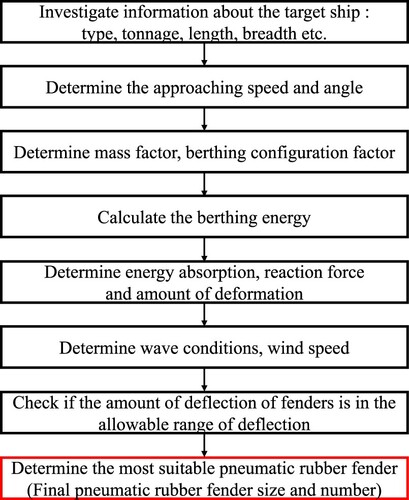
Table 6. Principal dimensions of the VLCC class FPSO and the Suezmax class shuttle tanker.
Table 7. Recommended number and size of pneumatic rubber fenders depending on the size of the tonnage (PIANC Citation2002).
Table 8. Examined case studies and the corresponding collision conditions.
Table 9. Mesh sizes for the structural crashworthiness analysis of a side-by-side collision.
Table 10. The number of elements for the structural crashworthiness analysis of a side-by-side collision.
Table 11. Material properties for modelling the hull structures of the FPSO and the shuttle tanker.
Figure 25. Finite element model of the FPSO hull equipped with five pneumatic rubber fenders and the shuttle tanker involved in a side-by-side collision.
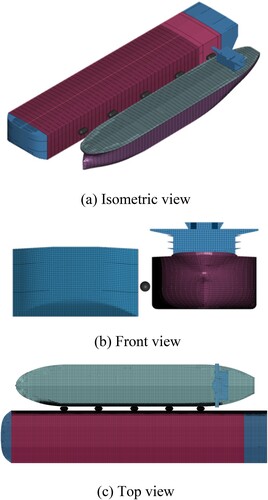
Table 12. Dynamic properties of steel for the analysis of structural crashworthiness during a side-by-side collision.
Figure 26. Structural damage on the FPSO hull with no pneumatic runner fenders at a 2-knot side-by-side collision between a Suezmax class shuttle tanker and an FPSO: (a) side view, (b) cross-sectional view.
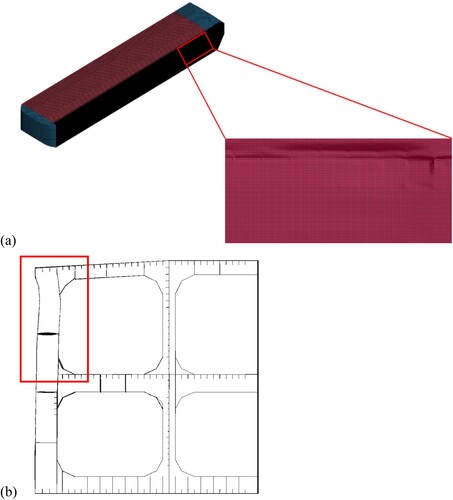
Figure 27. Collision-induced buckling of horizontal girders on the struck FPSO hull with no pneumatic rubber fenders.
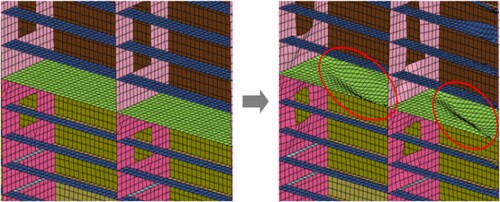
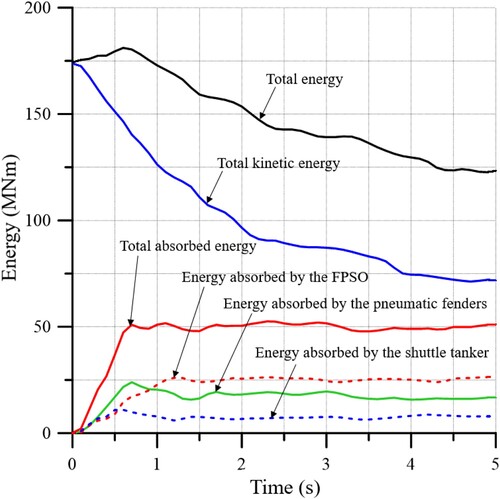
Figure 28. Change in absorbed energy components over time for the FPSO and shuttle tanker hulls with no pneumatic rubber fenders in a 2-knot side-by-side collision scenario.
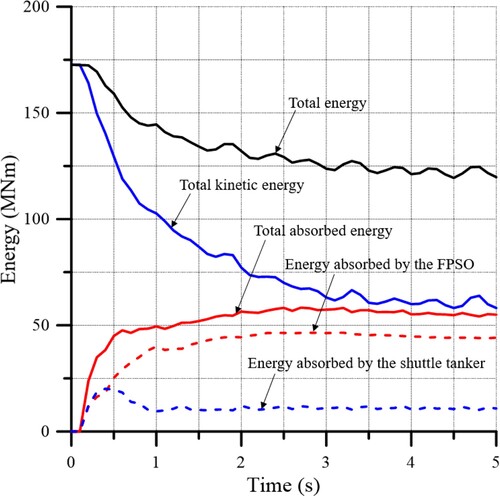
Figure 29. Change in absorbed energy components over time for the FPSO hull (equipped with 4 fenders) and the shuttle tanker hull in a 2-knot side-by-side collision scenario.
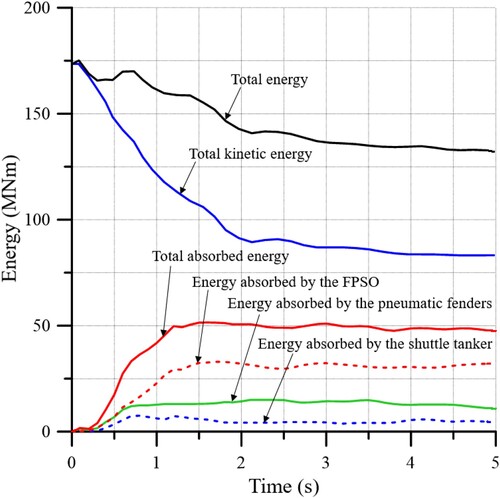
Figure 30. Change in absorbed energy components over time for the FPSO hull (equipped with 5 fenders) and the shuttle tanker hull in a 2-knot side-by-side collision scenario.