
Figures & data
Figure 1. Design parameters of the crescent-shaped profile. This figure is available in colour online.
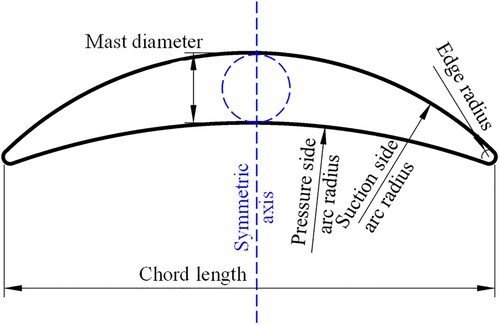
Figure 2. Crescent-shaped profiles based on different design parameters. This figure is available in colour online.
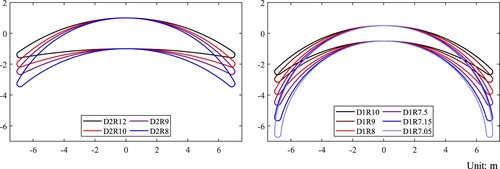
Figure 3. Force coefficients of different profiles. This figure is available in colour online.
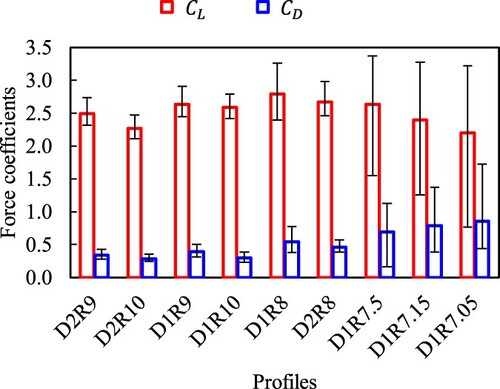
Figure 4. Concept design of the telescopic rigid wingsail. This figure is available in colour online.
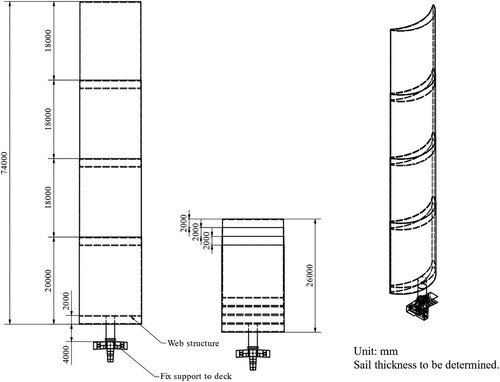
Table 1. Height and apparent wind speed of the two simulated conditions.
Table 2. Properties of the fluid (air at (Hilsenrath Citation1955)).
Figure 5. Coordinate system. This figure is available in colour online.
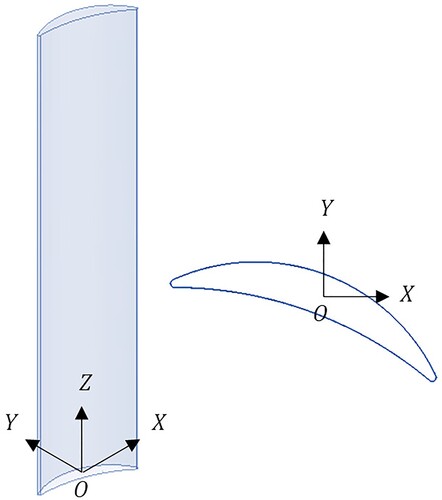
Figure 6. Computational domain and boundary conditions, fully expanded condition. This figure is available in colour online.
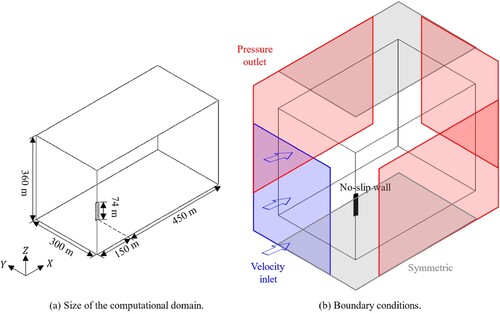
Figure 7. Time-averaged force coefficients vs. , based on two-dimensional CFD simulations. This figure is available in colour online.
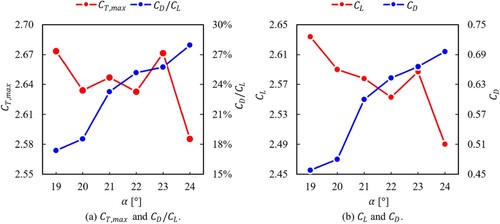
Figure 8. Numerical mesh with typical cell sizes. Fully expanded condition with . This figure is available in colour online.
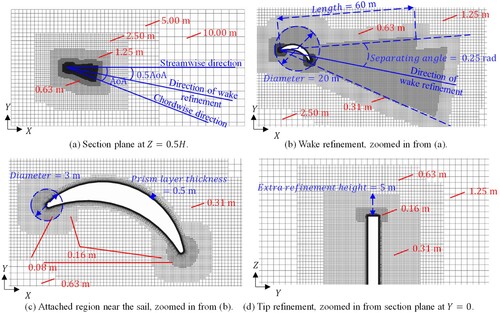
Table 3. Material properties.
Figure 9. Deformation displacement () from FSI results.
is the magnitude of displacement, i.e.
. This figure is available in colour online.
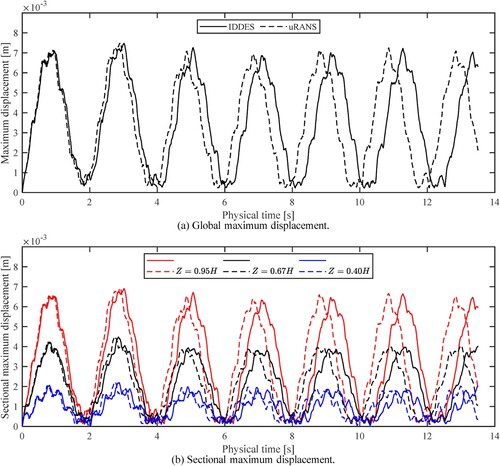
Figure 10. Distribution of DES upwind blending factor at different spanwise positions, fully expanded condition, . Blue marks out the regions calculated with LES, while the rest of the computation domain is calculated with uRANS. This figure is available in colour online.
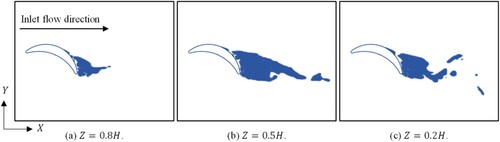
Figure 11. Boxplots of time-averaged force coefficients, fully expanded condition. This figure is available in colour online.
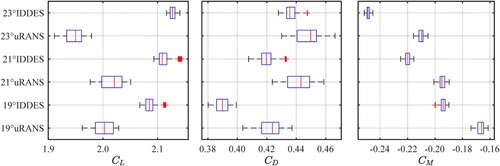
Table 4. Time-averaged force coefficients based on IDDES simulations.
Figure 12. Polar diagram of vs. wind directions. This figure is available in colour online.
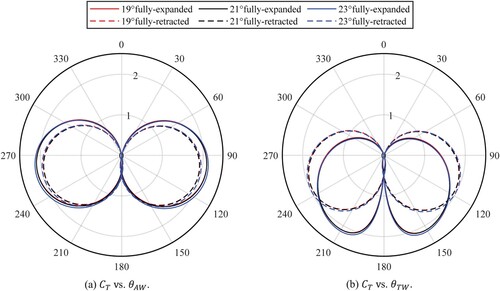
Figure 13. distribution and streamlines at different spanwise sections, fully expanded condition,
,
. This figure is available in colour online.
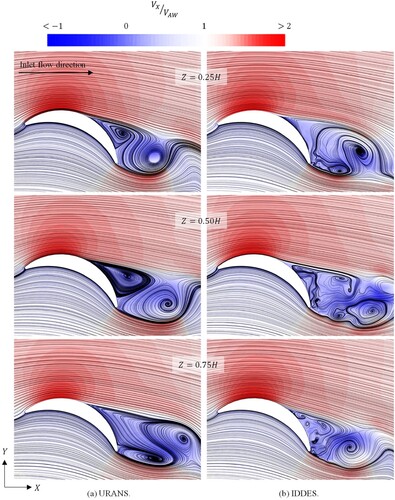
Figure 14. distributions and the flow separation/attachment lines,
. For the fully expanded condition,
, while for the fully retracted condition,
. This figure is available in colour online.
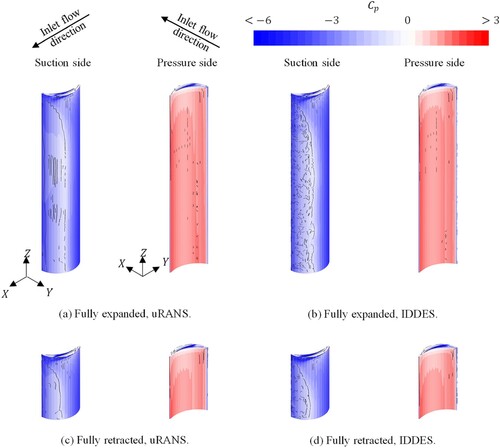
Figure 15. Simulation time history of the force coefficients, fully expanded condition. This figure is available in colour online.
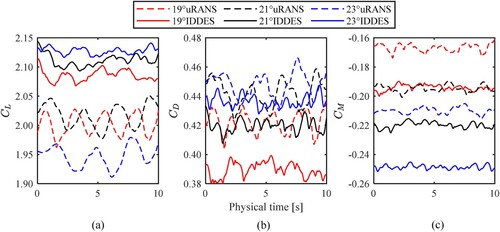
Figure 16. FFT results of , fully expanded condition. This figure is available in colour online.
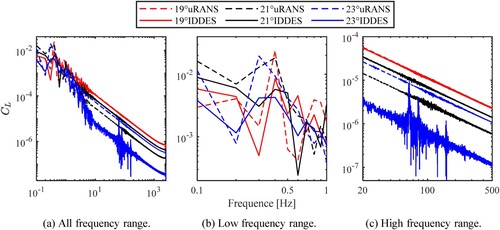
Figure 17. Non-dimensional distribution on iso-surfaces of the Q-criterion
, fully expanded condition,
,
. This figure is available in colour online.
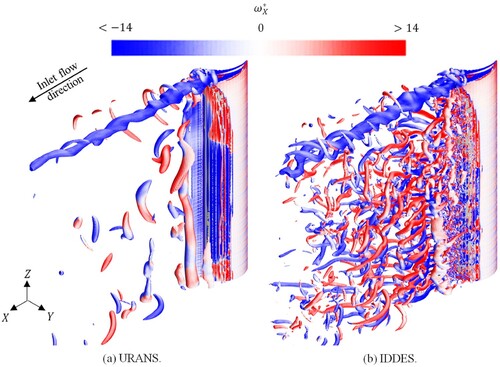
Figure 18. Non-dimensional distribution at different streamwise positions in the wake field, fully expanded condition,
,
. The inlet flow orients in the direction perpendicular to the paper/screen pointing outwards. This figure is available in colour online.
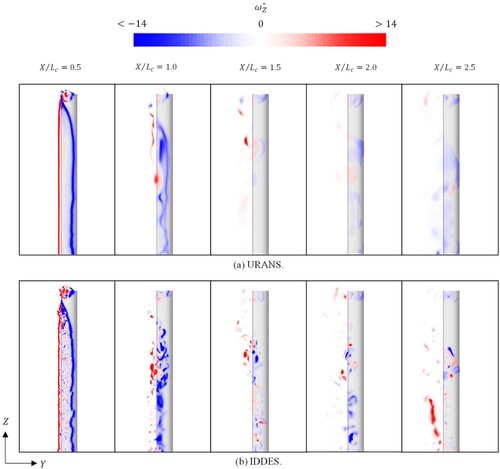
Figure 19. Non-dimensional distribution at different streamwise positions around the tip, based on the IDDES simulations,
. For the fully expanded condition,
, while for the fully retracted condition,
. This figure is available in colour online.
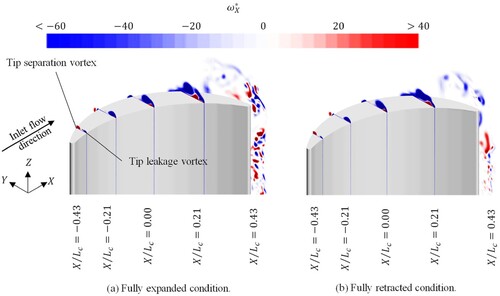
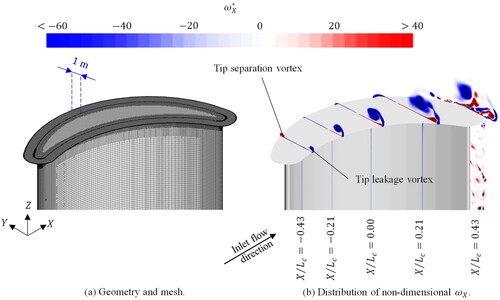
Figure 20. Geometry, mesh, and effects of the disc on top based on IDDES simulations, fully expanded condition, ,
. This figure is available in colour online.
Data availability statement
The data that support the findings of this study are available from the corresponding author, Heng Zhu, upon reasonable request.
| Nomenclature | ||
| = | Drag force coefficient [-] | |
| = | Lift force coefficient [-] | |
| = | Moment coefficient [-] | |
| = | Pressure coefficient [-] | |
| = | Thrust force coefficient [-] | |
| = | Maximum thrust force coefficient [-] | |
| = | Young’s modulus [ | |
| = | Sail height (spanwise length) [ | |
| = | Chord length [ | |
| = | Pressure [ | |
| = | Q-criterion [ | |
| = | Reynolds number [-] | |
| = | Apparent wind speed (inlet velocity) [ | |
| = | Ship speed [ | |
| = | True wind speed [ | |
| = | Streamwise velocity [ | |
| = | Deformation displacement [ | |
| = | Dimensionless wall-normal distance [-] | |
| = | Angle of attack [ | |
| = | Critical angle of attack [ | |
| = | Apparent wind angle [ | |
| = | True wind angle [ | |
| = | Dynamic viscosity [ | |
| = | Air density [ | |
| = | Aluminum density [ | |
| = | Poisson’s ratio [-] | |
| = | Yield stress [ | |
| = | Streamwise vorticity [ | |
| = | Non-dimensional streamwise vorticity [-] | |
| = | Spanwise vorticity [ | |
| = | Non-dimensional spanwise vorticity [-] | |