Figures & data
Figure 1. 500 m service areas around Metrosur stations.
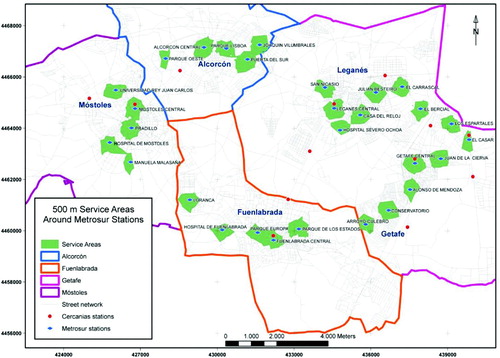
Figure 2. Sum of employment density around a 500 m service area.
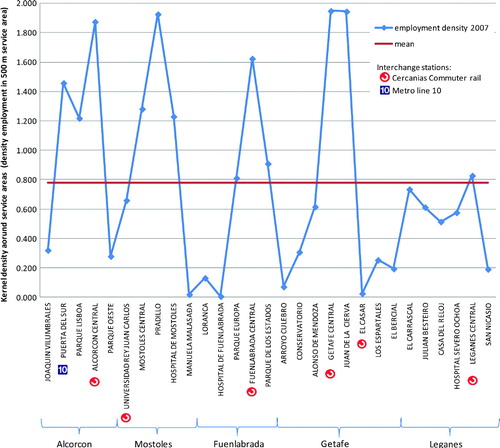
Figure 3. Increase of firms' density location between 1998 and 2007 around 500 m service areas.
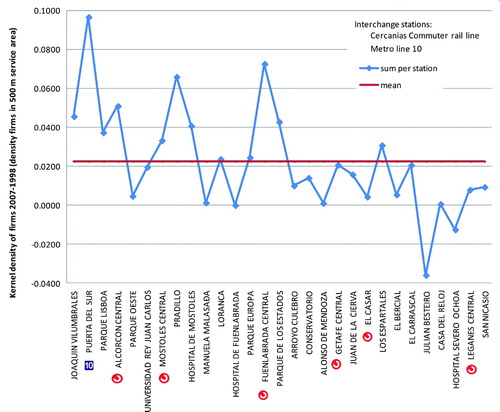
Figure 4. Regression model graph.
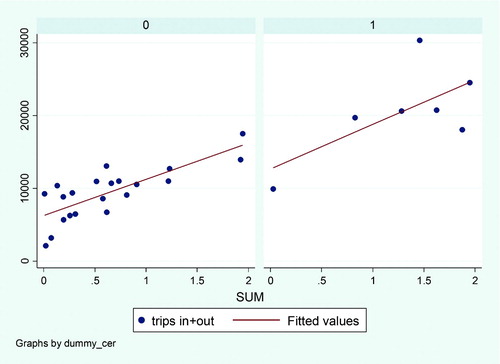
Table 1. Regression model.
Supplemental material