Figures & data
Figure 1. Example of AIS 5-hour tracks (black, from a network of terrestrial receiversFootnote2) compared to historical LRIT derived density using historical data (coloured). Spatial coverage issues can be observed as broken tracks away from the coast and in areas where AIS receivers are not available.
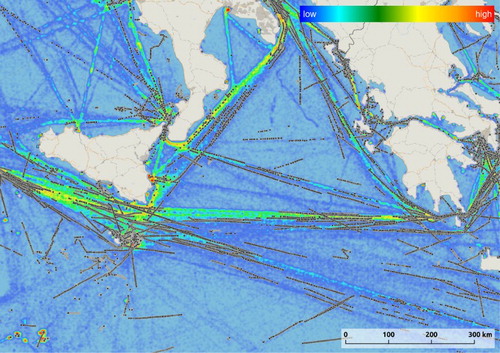
Figure 2. Historical LRIT density (data provided by the EU LRIT CDC contributing states) highlighting areas where maritime traffic is highly structured and regulated by traffic separation schemes and other ship routeing systems.
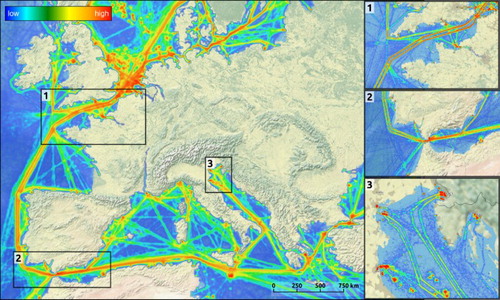
Figure 3. NOx emissions estimated for the year 2010.
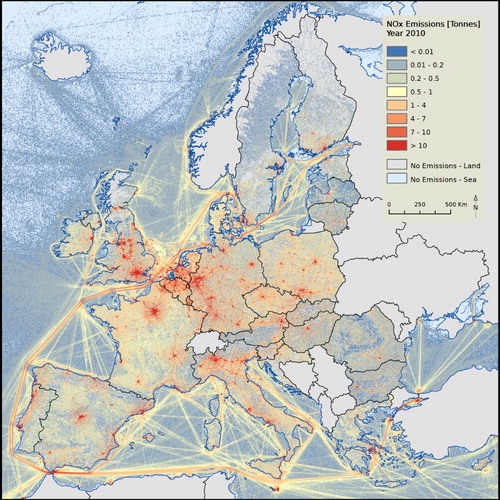
Figure 4. SO2 emissions estimated by EDGARv4.3.1 for the year 2010 distributed with LRIT proxy for the Mediterranean, Black and Baltic Seas and with CitationWang et al. (Citation2008) proxy for the rest.
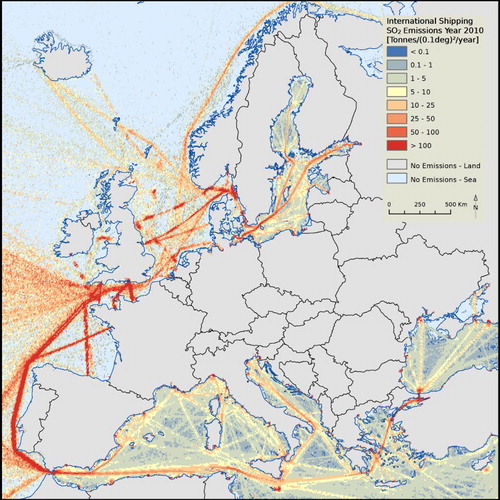
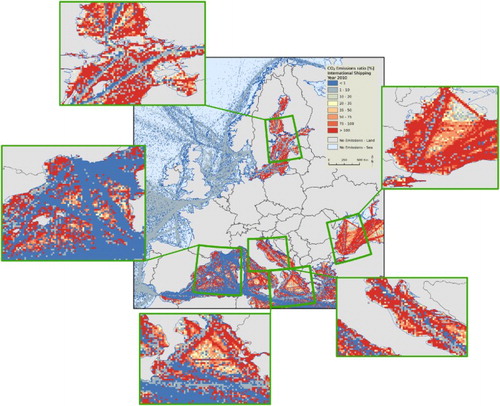
Figure 5. Difference in CO2 emissions for 2010 between the original EDGARv4.3.1 grid maps and the new grid maps published here using LRIT in the Mediterranean, Black and Baltic Seas. Focus in the Adriatic and Black Sea shows red dots, indicating the increased marine traffic, which is representative for the port activities around these seas; focus on the Ionic Sea shows a displacement of the traffic near the coast of Italy and Greece; focus on the Ligurian and Balearic Seas shows blue dots, indicating the decreased marine traffic; focus on the Baltic Sea shows a more diffusive distribution than what was originally suggested by CitationWang et al. (Citation2008).