Figures & data
Figure 1. Extent of INFOMAR MBES bathymetry data used in this study (A) and same data gradated to 0–40 m (shallow), 40–60 m (transitional) and >60 (deep) representing preferred ranges for technology types (B).
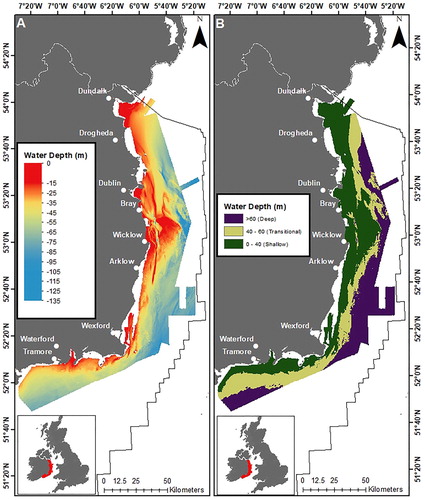
Figure 2. Parameters derived from bathymetric data: (A) rugosity and (B) slope greater than significant gradient threshold (i.e. > 5°).
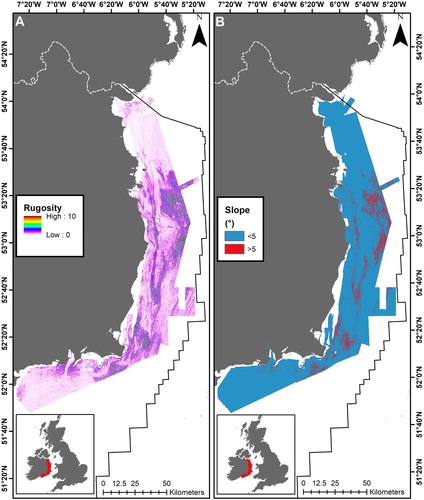
Figure 3. Parameters derived from bathymetry using ArcGIS Benthic Terrain Modeler: (A) broad-scale BPI and (B) fine-scale BPI.
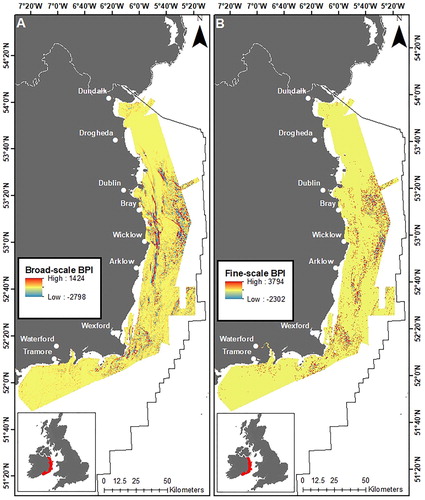
Figure 4. Backscatter (A) and sediment classification (B) data available from INFOMAR used in this study.
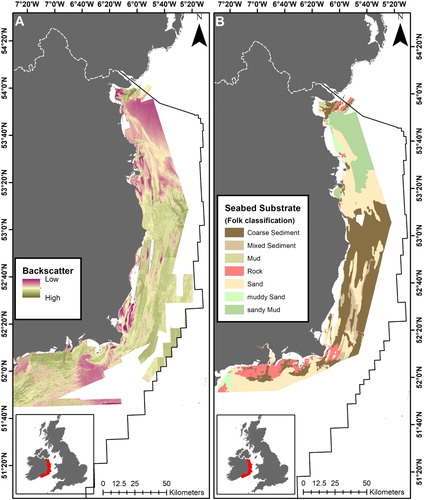
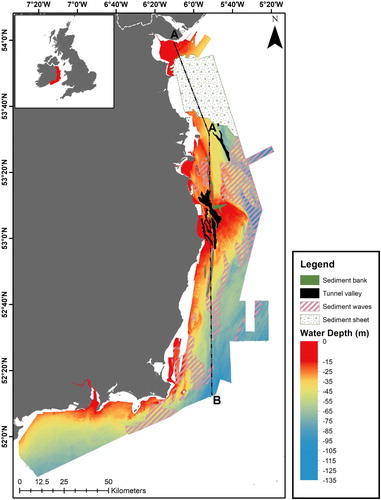
Figure 5. Profile A-A’-B in with annotated features.
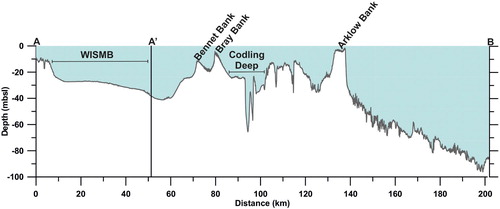
Figure 6. Seabed sediment distribution in the Irish Sea (modified CitationFolk (1954) classification) with superimposed morphological features (according to CitationDove et al., 2016), sediment wave direction (CitationVan Landeghem et al., 2009), bedload parting zones (CitationVan Landeghem et al., 2009) and indicative, average bedform migration rates (CitationVan Landeghem et al., 2012).
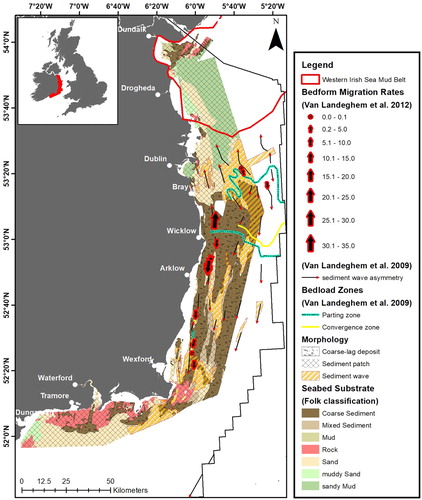
Table 1. Geological features creating possible geotechnical constraints in the Irish Sea (after CitationMellet et al., 2015)
Figure 7. Geological and geotechnical constraints mapped in the Irish Sea superimposed on OREDP assessment areas.
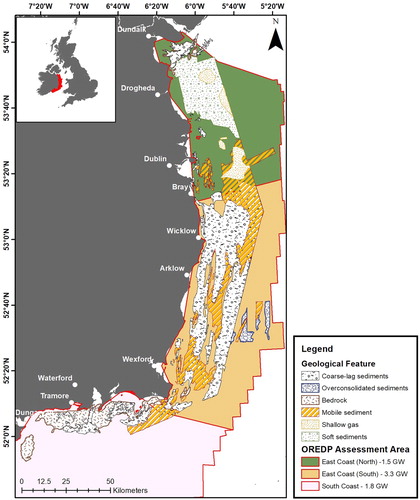
Figure 8. Geomorphological classification of the Irish Sea INFOMAR data using the classification scheme of CitationDove et al. (2016).