Figures & data
Figure 1. Kinematic complexes of the Campania region (modified from CitationVitale & Ciarcia, 2018).
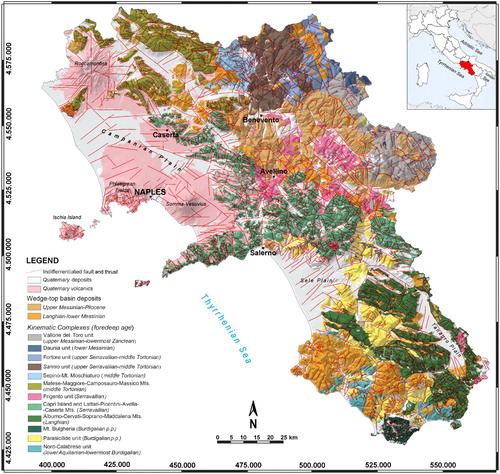
Table 1. Multiplying weights (wi) considered by the SINTACS method for the five hydrogeological scenarios (CitationCivita & De Maio, 2000).
Figure 2. Range of ISINTACS for PAs belonging to Quaternary alluvial (A) and volcanic (B) hydrogeological domains.
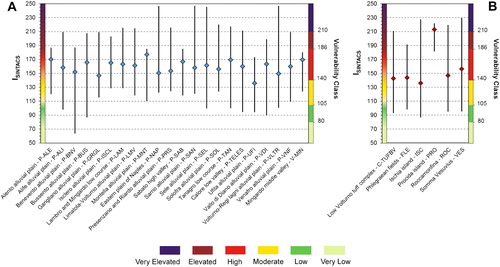
Figure 3. Range of ISINTACS for PAs belonging to Miocene-Pliocene turbidite, molasse and clastic (A) and Cretaceous-Paleogene basin series hydrogeological domains (B).
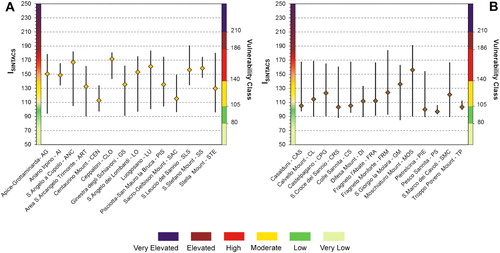
Figure 4. Range of ISINTACS for PAs belonging to Mesozoic limestone (A) and Mesozoic dolomite (B) hydrogeological domains.
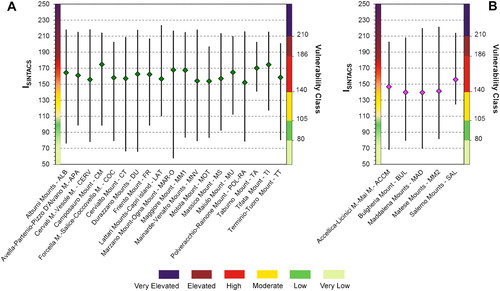
Figure 5. Range of ISINTACS for PAs of the six hydrogeological domains. Mean values are weighted by the outcropping areas of PAs.
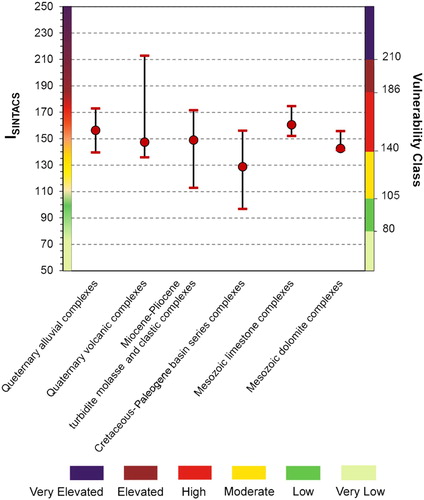
Figure 6. Extension of SINTACS groundwater vulnerability classes for principal hydrogeological domains.
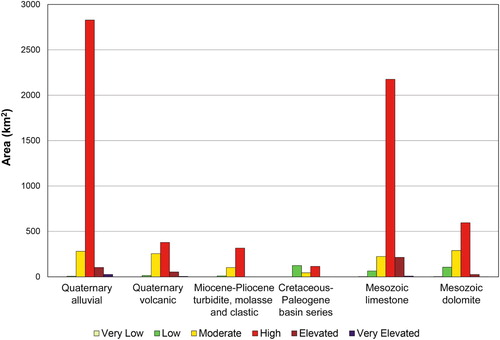
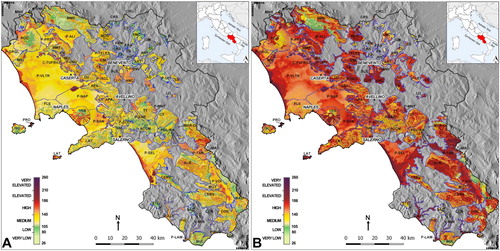
Figure 7. Map of minimum ISINTACS (left) and maximum ISINTACS (right) of the PAs of the Campania region obtained by a sensitivity analysis applied to Impact of vadose zone, Soil media and Hydrogeological characteristic of the Aquifer parameters.