
Figures & data
Figure 1. Survey areas, sub-areas and 1:250 K map sheets. NORI stands for Nauru Ocean Resources Incorporated; TOML for Tonga Offshore Mining Limited; Marawa for Marawa Research and Exploration Limited.
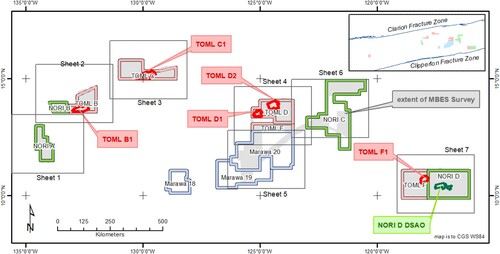
Figure 2. Deposit scale survey areas (a) basement ages and (b) extrapolated stratigraphy. Green isochrons at left are from CitationBarckhausen et al. (2013), while the brown isochrons are from CitationMüller et al. (2016) DSDP site 159 information is from Citationvan Andel et al. (1973a), site 160 from Citationvan Andel et al. (1973b) and migration estimates based on the work of Citationvan Andel et al. (1975).
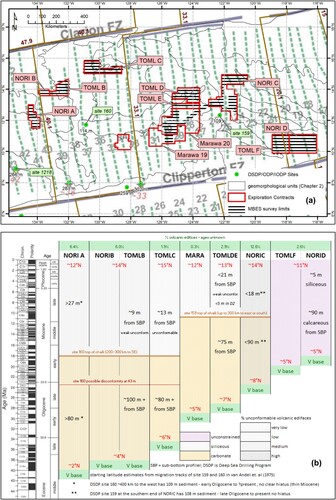
Figure 3. Example potholes. (a) Circular and ‘trough’ shaped features in Sheet 1, (b) potholes grading to escarpments in western Sheet 2, (c) line of potholes associated with a dyke off the volcanic edifice to the NW in eastern Sheet 2, (d) association of potholes only with a wider hill in Sheet 3, (e) smaller potholes in Sheet 4D, (f) potholes amongst artefacts in the bathymetry in western Sheet 7.
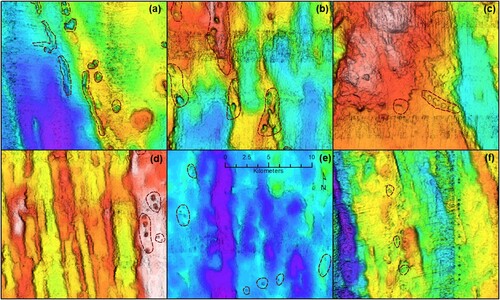
Figure 4. Example Carbonate Strata Breccia in sub-bottom profile (SBP) data. (a) Breakthrough type carbonate strata breccia (CSB) bounded by a large dyke in map sheet 2; (b) breakthrough CSB transitioning to a stratabound CSB in map sheet 3; (c) stratabound CSB in centre and breakthrough CSB’s nearer to the valley margin in map sheet 2; (d) small stratabound CSB in map sheet 4.
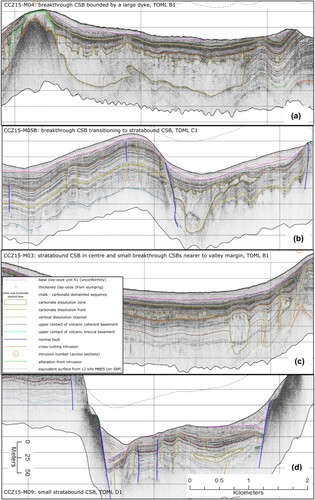
Figure 5. Example variable clay-ooze map in SBP data. SBP line is CCZ15-M08, in sheet 4. Clay-ooze of the Clipperton formation is above the pink dashed line.
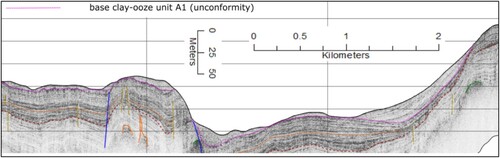
Figure 6. Example knolls and seamount on MBES. (a) Carbonate capped ‘pancake’ mound, sheet 1; (b) low backscatter reflectance knolls, sheet 2; (c) composite knolls, sheet 2; (d) coherent-lava seamount, sheet 4; (e) knolls aligned along a depression, sheet 3; (f) knoll split across an abyssal ‘valley’.
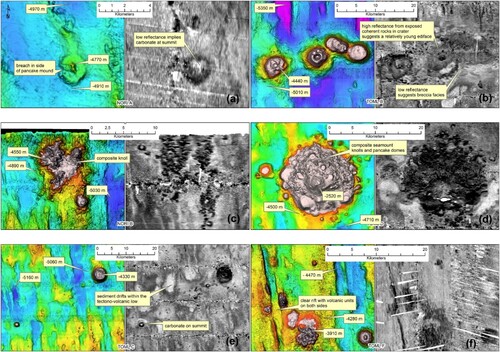
Figure 7. Example intrusions in SBP data. (a) Dyke swarm (with hornfels); (b) and sill with feeders.
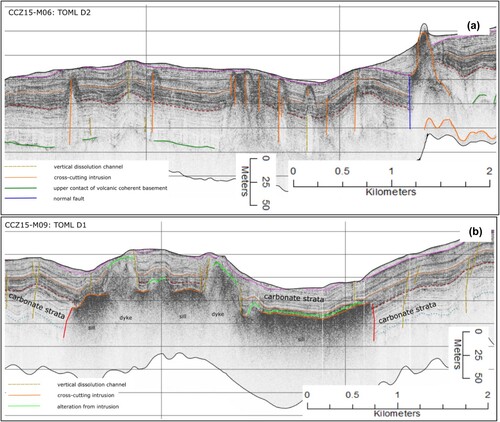
Table 1. MBES 1:250,000 interpretation – detailed legend.
Supplemental Material
Download Zip (80.2 MB)Data availability statement
GIS data can be provided on written request to the authors.