
Figures & data
Figure 1. Italian map of VS30 (50° percentile) modified after CitationMori et al. (Citation2020). Po plain and Apulia, discussed in the text, are shown in the figure.
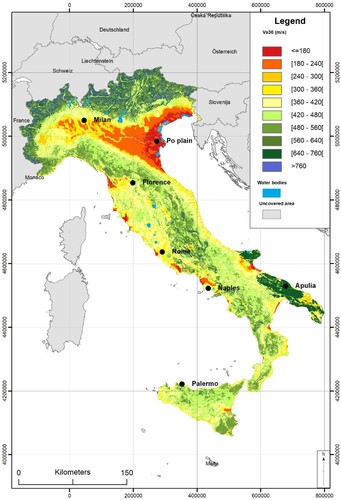
Figure 2. Italian map of AFPGA (50° percentile). Po plain and Apulia, discussed in the text, are shown in the figure.
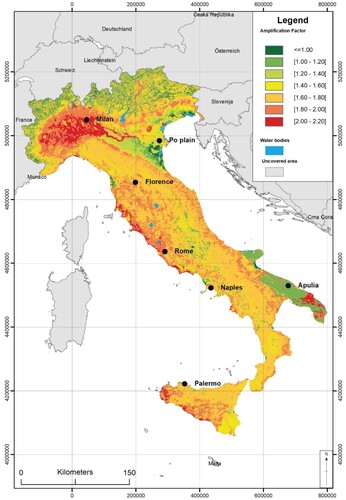
Figure 3. Italian map of AFPGV (50° percentile). Po plain and Apulia, discussed in the text, are shown in the figure.
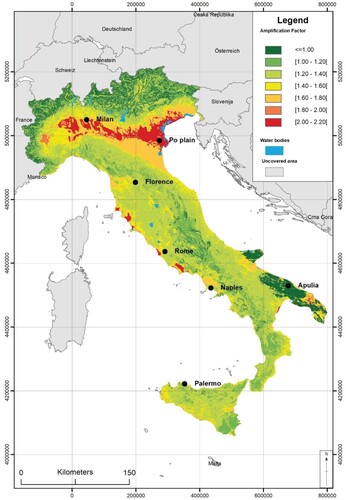
Figure 4. Box plots of the error ϵAF obtained comparing IGAG_20 AFs and results from site-specific LSSR analyses with reference to about 4,500 locations.
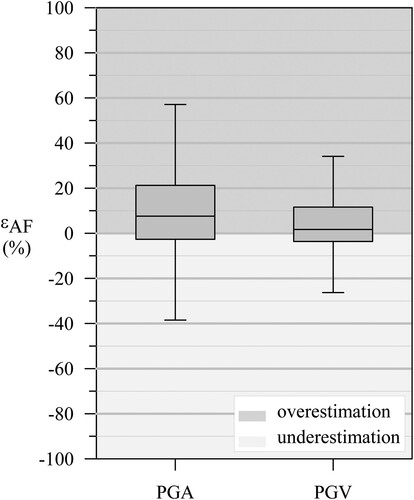
Figure 5. An Italian map of AFPGA (16° percentile).
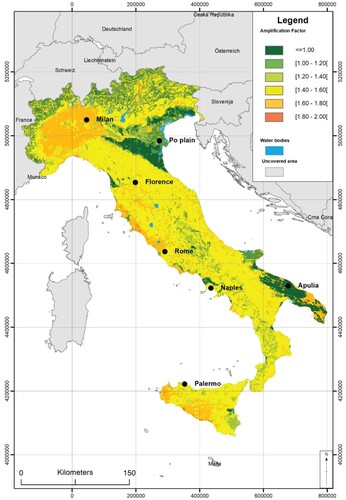
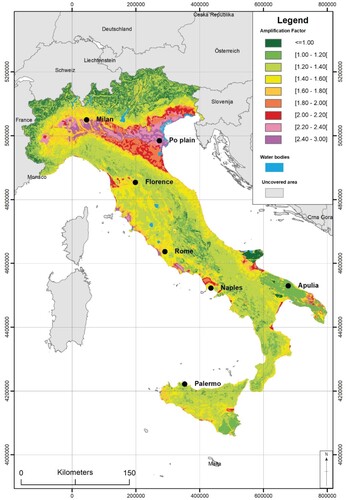
Figure 6. Italian map of AFPGV (16° percentile).
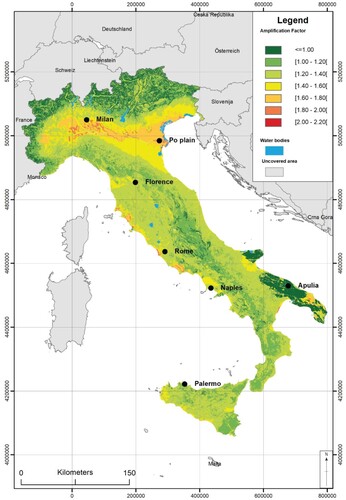
Figure 7. Italian map of AFPGA (84° percentile).
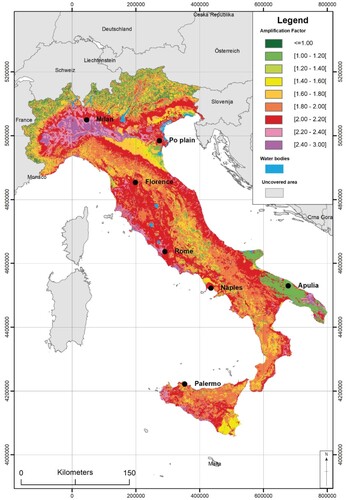
Figure 8. Italian map of AFPGV (84° percentile).
TJOM_2101947_Supplemental_files
Download Zip (13.4 MB)Data availability statement
The data that support the findings of this study are available from Istituto di Geologia Ambientale e Geoingegneria (Institute of Environmental Geology and Geoengineering of the Italian National Council of Research). Restrictions apply to the availability of these data, which were used under license for this study. Data are available from the authors with the permission of Istituto di Geologia Ambientale e Geoingegneria (Institute of Environmental Geology and Geoengineering of the Italian National Council of Research).