
Figures & data
Figure 1. Data processing diagram. Source: authors’ own.
Flowchart describes the data processed through GIS in order to represent the socioeconomic inequality related to tailings deposits in Chile. Two input databases are used; multidimensional poverty index by communes and mining deposits cadastre obtained from the National Geology and Mining Service, updated to 2020. From the latter, we proceed to select only the communes that have mining tailings deposits. This selection of data is crossed with the multidimensional poverty data by commune, creating a new attribute. According to these results, the communes are grouped considering the reference line (national average of the poverty index). Then the groupings are categorized according to the concentration of tailings deposits. Finally, the output data will be the following classifications: (i) 1 to 2 deposits low concentration (ii) 3 to 9 deposits medium concentration (iii) 10 to 44 deposits high concentration (iv) 45 to 123 deposits very high concentration. The results are mapped for subsequent comparative analysis between groups above and below the national average of the multidimensional poverty index used as a baseline.
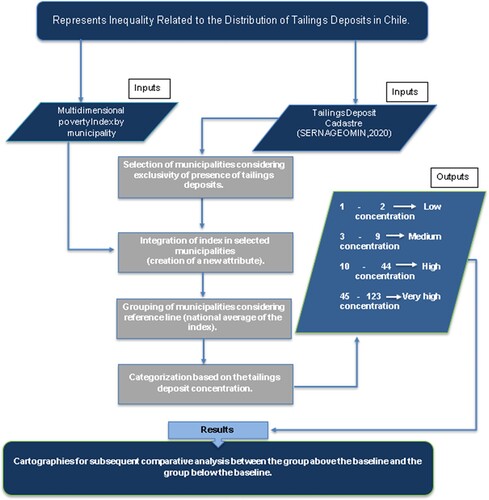
Figure 2. Scatter diagram. Source: authors’ own.
A purple horizontal line is drawn on the Y-axis at 20.7, a yellow line is drawn at 25.5, which establishes the average multidimensional poverty index of the communes with at least one tailings deposit, a red line at 28.07 represents the average of map 2, and a green line at 17.27 represents the average of map 1.
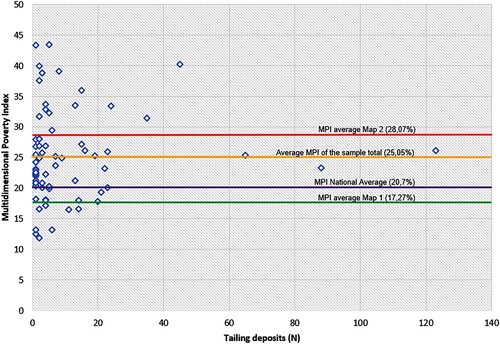
Table 1. Municipalities and concentration of tailings deposits.
Table 2. Category in relation to multidimensional poverty average.
Table 3. Municipalities, multidimensional poverty and tailings deposits (frequency in relation to concentration of tailings deposits).
Supplemental material
Supplemental Material
Download MS Word (17 KB)Above.eps
Download EPS Image (3.4 MB)MAPA_1_CORREGIDO.pdf
Download PDF (3.4 MB)MAPA_2_CORREGIDO.pdf
Download PDF (3.5 MB)Below.eps
Download EPS Image (3.3 MB)Data availability statement (DAS)
The database ‘Tailings deposits and multidimensional poverty in Chile’ that we built in this research, is available in open access so that researchers can replicate the study or use the data: https://doi.org/10.5281/zenodo.7044851
.