Figures & data
Figure 1. Three-dimensional representation of a proposed wind catcher design with operable louvres closed (a), open (b) and cross section showing internal partitions (c).
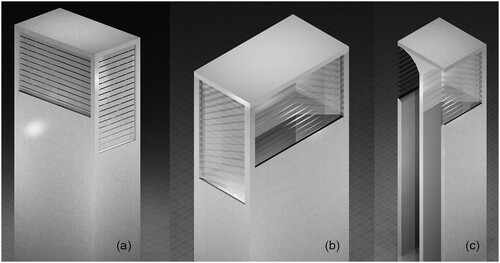
Figure 2. Street view of the case study building (by authors).
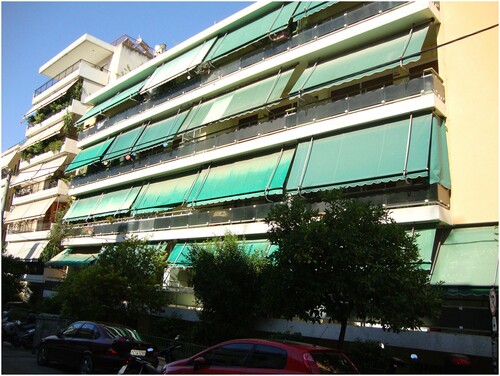
Figure 3. Psychrometric chart for adaptive comfort showing comfort potential of different design strategies for the climate of Athens.
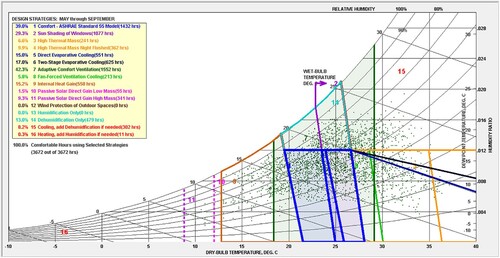
Figure 4. Layout of the case study apartment showing the location of current openings and the identified appropriate locations for low-energy refurbishment measures.
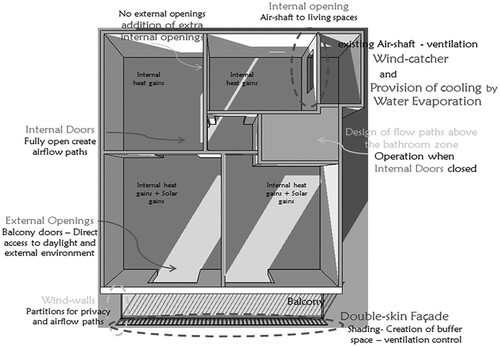
Figure 5. Plan view drawing of a typical floor of the case study building showing the location of 3 lightwells and the potential locations for the design of wind-catchers (11).
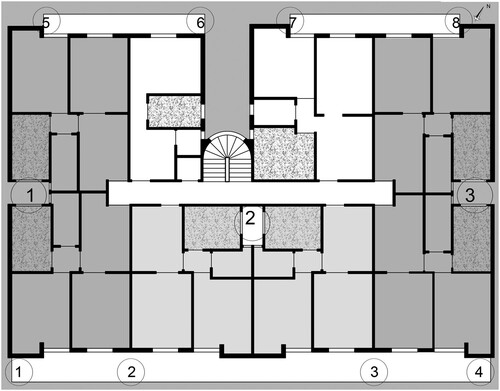
Figure 6. South elevation of the case study building showing the three wind-catchers integrated at the building core on top of the lightwells.
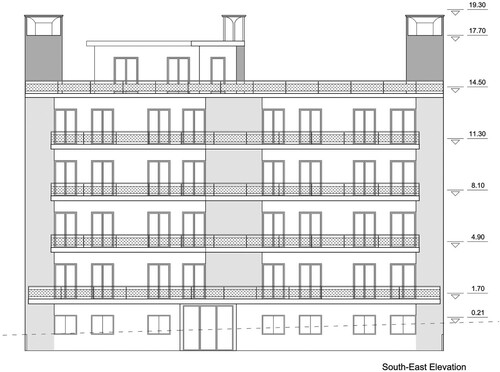
Figure 7. Plan view of the apartment’s balcony showing the louvres and partition walls (left) and a 3D close-up of the louvres (right).
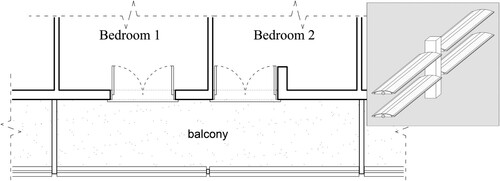
Figure 8. Cross-sections of the balcony and the dynamic façade under different operations.
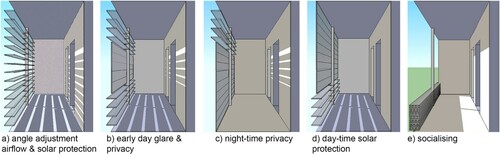
Figure 9. South elevation of the case study building showing the operation of the dynamic façade.
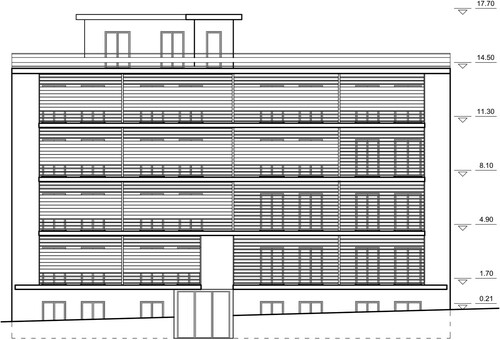
Figure 10. Streamlines of the airflow movement in the spaces, showing the starting and final point of the flow single-sided (left) and cross ventilation (right), for 7 m/s north wind and air temperature of 26°C.
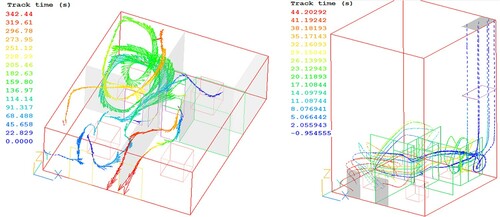
Figure 11. Streamlines of the airflow movement in the spaces, showing inflow through the wind-catcher (blue) and outflow through the patio openings (red) (7 m/s north wind and outdoor temperature 26°C).
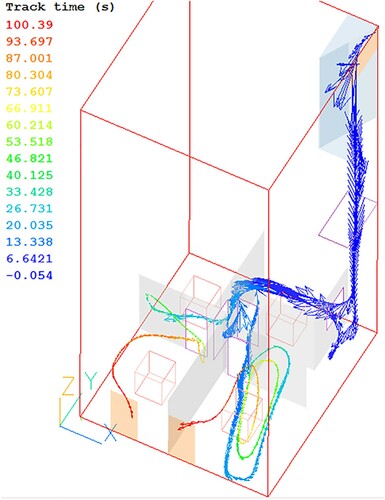
Figure 12. 3D representation of the building showing temperature distribution on 2D planes across four apartments and the velocity distribution on a 2D representation of the building during (north wind of 7 m/s and 26°C air temperature).
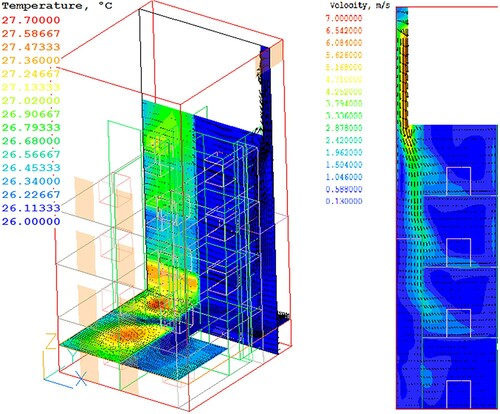
Figure 13. Velocity contours and vectors at y, z cross section of the second bedroom, balcony and dynamic façade. All louvres fully open (a), upper and lower open (b) and only upper open (c) according to (3.6 m/s east wind at 26°C).
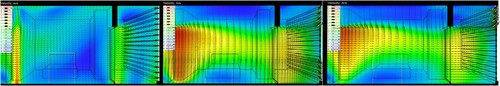
Figure 14. Predicted indoor air velocity (left) and temperatures (right) at 100 points along two lines at 1.5 m height from (3.6, 0, 1.5) to (3.6, 9.3, 1.5) from the façade to the rear spaces, for 3 louvre positions.
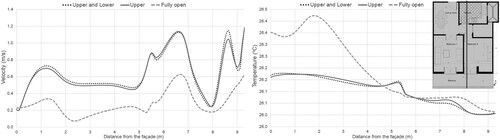
Figure 15. South elevation of the case study building showing the façade wind-catchers and the dynamic façade.
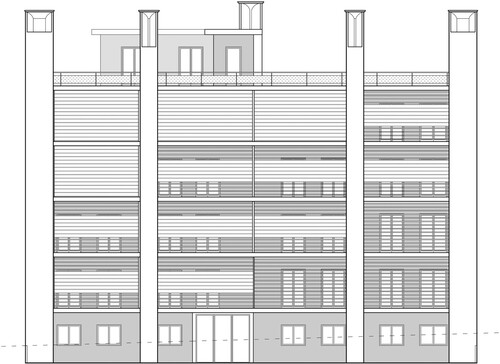
Figure 16. Temperature (left) and velocity (right) distribution on 2D-plane at the selected apartment (north, 7 m/s wind and 26°C air temperature).
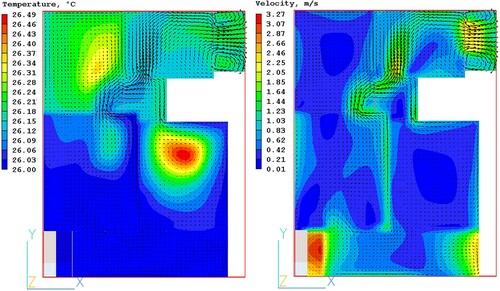
Figure 17. Airflow representations through streamlines (north, 7 m/s wind and 26°C air temperature).
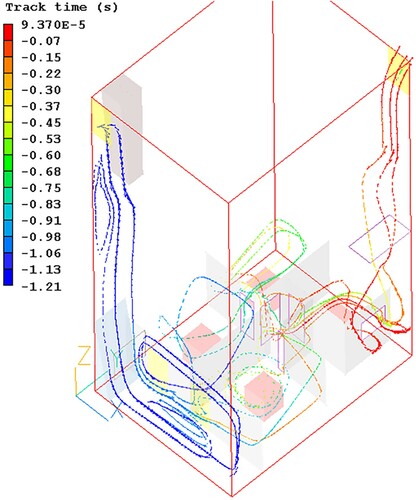
Table 1. Predicted indoor average air temperatures and velocities at a horizontal plane (1.5 m height above each apartment floor) for the natural ventilation strategies studied at the four apartments.
Figure 18. Three-dimensional representation of the apartment spaces showing the new hallway openings.
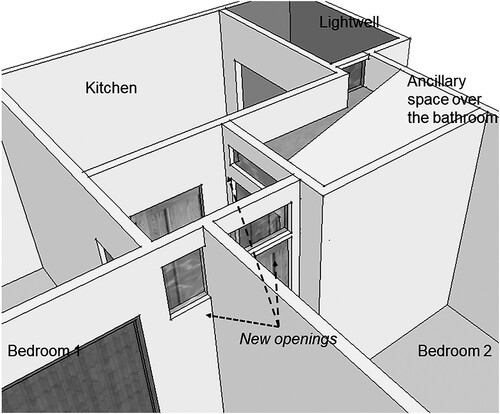
Figure 19. Temperature at 1.5 m (left) and velocity at 2.5 m height (right) contours and vectors on xy plane from the apartment floor during wind-driven ventilation of the ‘internal openings’ strategy (north, 7 m/s, 26°C).
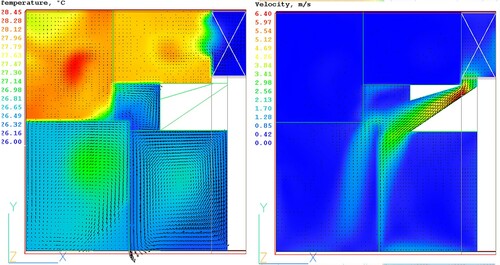
Figure 20. Relationship between outdoor running mean and operative temperatures for two refurbishment strategies, and comfort bands according to BSEN12521 and SCATs.
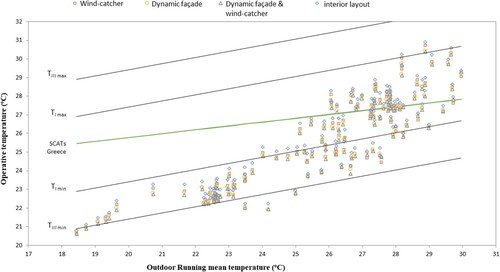
Figure 21. Relationship of wind-speed and difference between indoor and outdoor air temperatures for the low-energy refurbishment strategies.
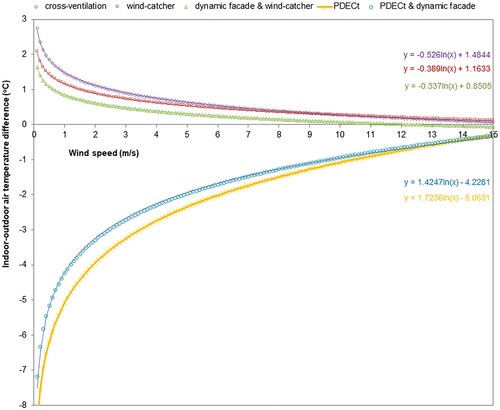
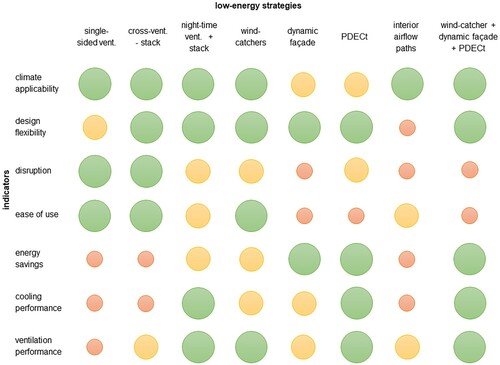
Figure 22. Conceptual matrix for low-energy refurbishments, showing optimum to least optimum performance from green to orange and red, respectively.