Figures & data
Figure 1. School A – classroom design.
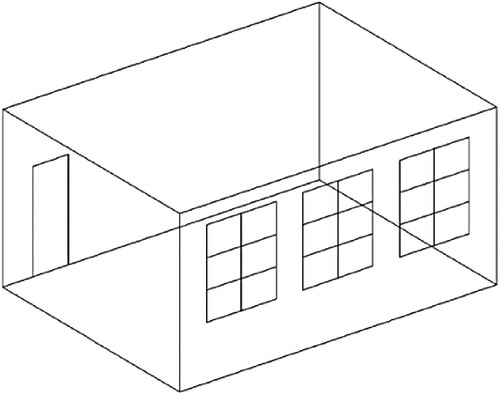
Table 1. Classroom sizes and occupancy details.
Figure 2. School B – classroom design.
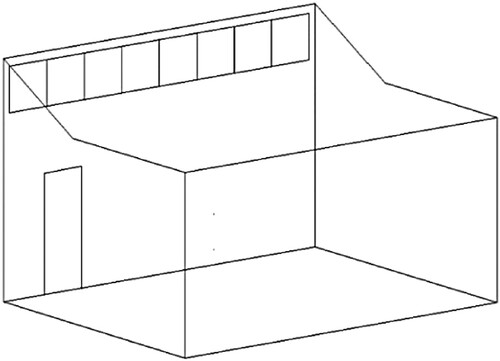
Table 2. BSA and CO2 generation rate of children.
Figure 3. School A – ACH when unoccupied with windows and door closed.
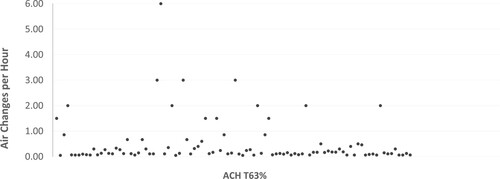
Figure 4. School B – ACH when unoccupied with doors closed and windows open.
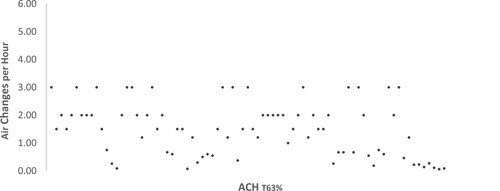
Table 3. Designed v. Actual ACH.
Figure 5. Daily peak and mean CO2 levels over the monitored period.
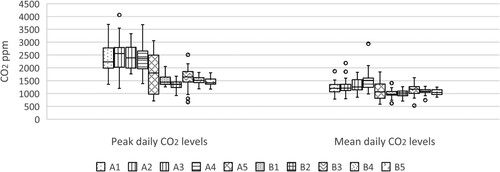
Figure 6. All classrooms – % time that CO2 levels are under & over 1000 ppm.
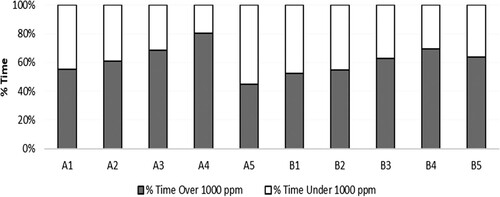
Figure 7. School A – ACH when occupied.
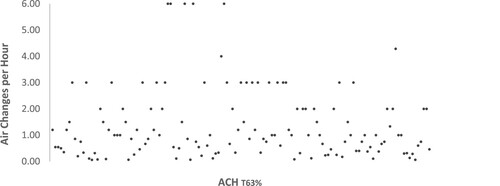
Figure 8. School B – ACH when occupied.
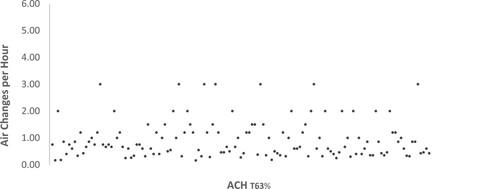
Table 4. Occupant generated CO2 by class duration.
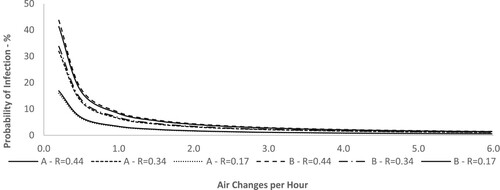
Figure 9. School A – probability of infection during standard 60-minute class at reduced ACH levels.

Figure 10. School B – probability of infection during standard 40-minute class at reduced ACH levels.
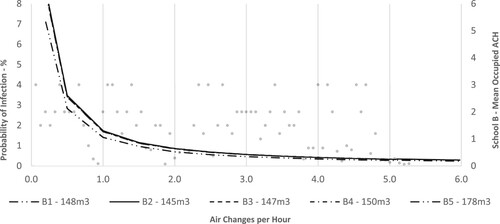
Figure 11. School A – probability of infection during an 8-hr school day at reduced ACH levels.
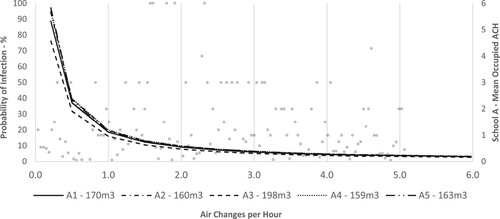
Figure 12. School B – probability of infection during an 8-hr school day at reduced ACH levels.
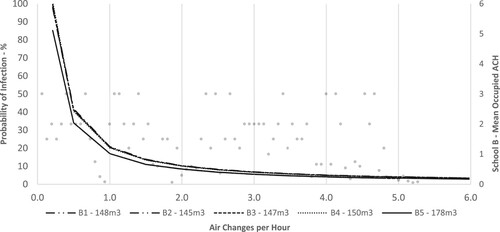
Figure 13. Probability of infection at adjusted odds ratios during standard 60-minute (School A) and 40-minute (School B) class.
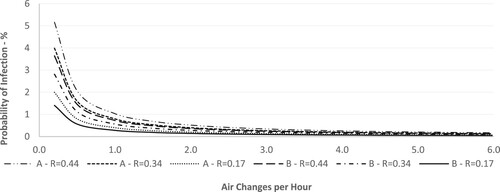
Figure 14. Probability of infection at adjusted odds ratios in both Schools during 8-hour day.