Figures & data
Figure 1. (a) SE images of AlSi10Mg powder (inset shows cross-sectioned powders), and (b) particle size distribution.
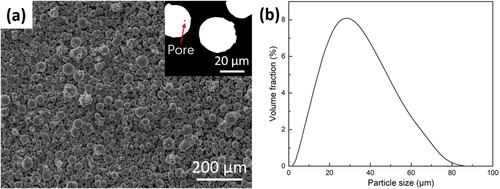
Figure 2. OM images showing typical surface morphologies of SLM specimens fabricated in two melting modes: (a) CM, and (b) KM.
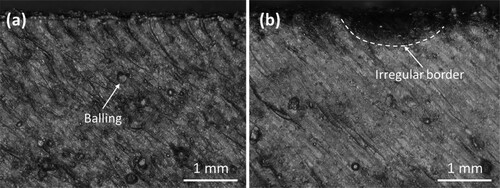
Figure 3. OM images of SLM AlSi10Mg specimens fabricated in two melting modes: (a) and (c) CM, and (b) and (d) KM.
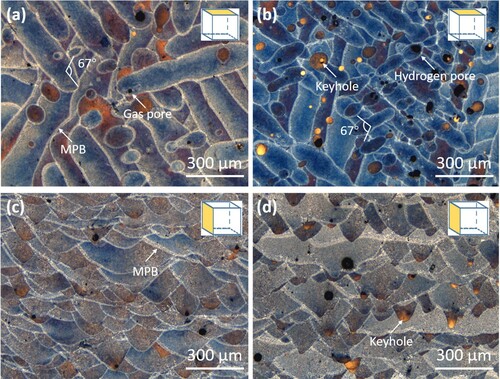
Figure 4. XRD patterns from the alloy powder and the SLM specimens.
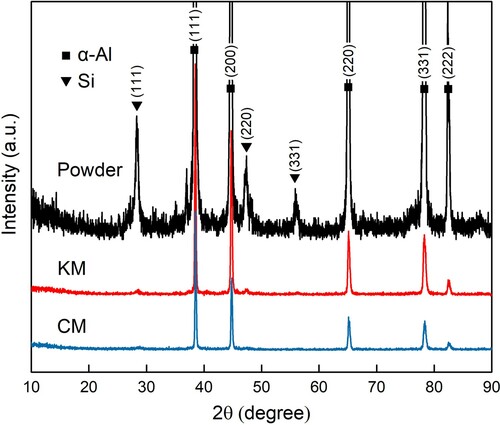
Figure 5. SE and inset BF TEM images of SLM AlSi10Mg specimens for the two melting modes: (a) and (c) CM, and (b) and (d) KM.
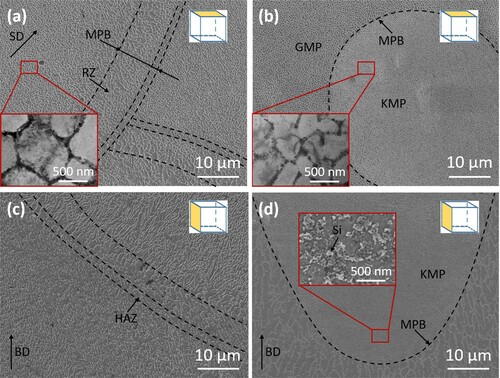
Figure 6. (a) Inverse pole figure (IPF) map and (b) image quality (IQ) map on the top view of the KM specimen.
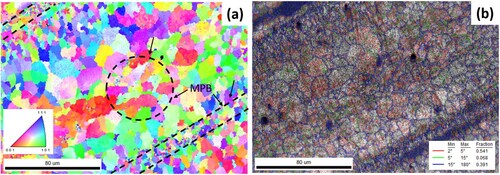
Figure 7. HAADF-STEM image of the cells in KMP and corresponding EDS mapping of the main elements (Al, Si, Mg and Fe).
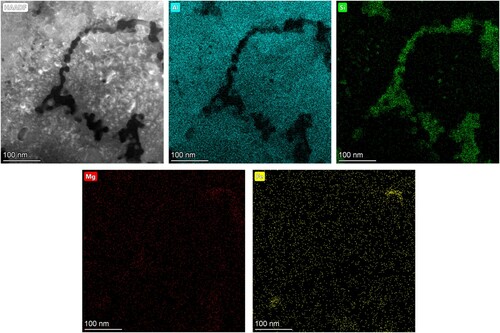
Figure 8. Schematic representation of thermal history during (a) CM and (b) KM.
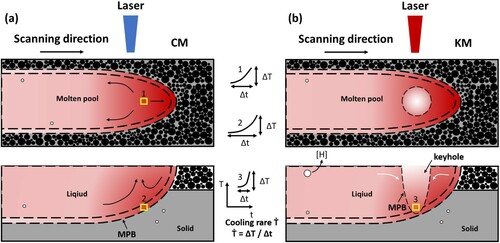
Figure 9. (a) Friction coefficients versus sliding time and (b) wear rates for the SLM and as-cast specimens.
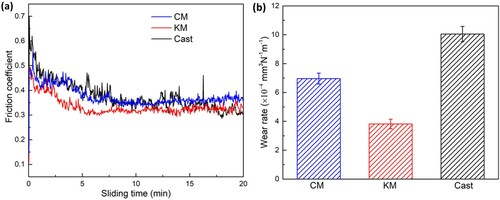
Table 1. Friction coefficients (μ) of the steady state wear.
Figure 10. Topography and 3D surface profiles of the worn surfaces, and SE images of debris for (a) CM, (b) KM and (c) as-cast specimens.
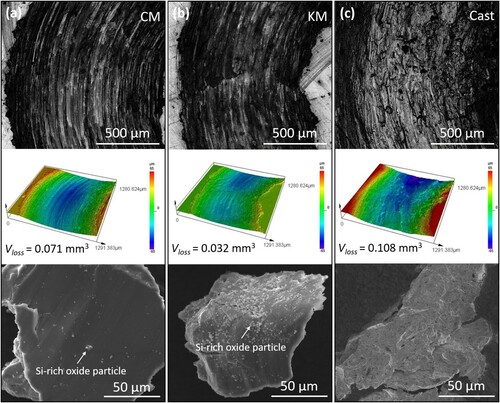
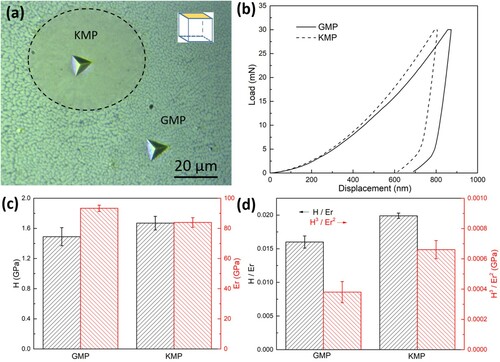
Figure 11. (a) Nanoindentation positions in the two molten pools from the top view in the KM specimen; (b) corresponding load-displacement curves; (c) the values of H and Er; and (d) H/Er and ratios.