Figures & data
Figure 1. Schematic of (a) a typical LPBF machine, (b) gas circulation system, and (c) LPBF process parameters. Reproduced from Wen et al. (Citation2019) (a and b) and Yap et al. (Citation2015) (c).
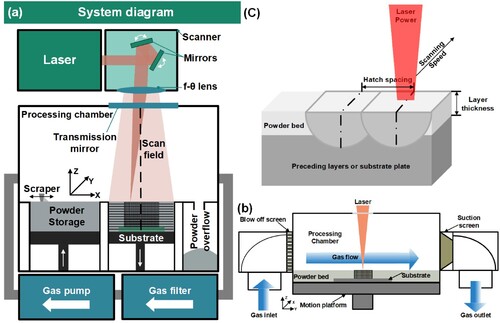
Figure 2. The illustration of the as-built microstructure formation. Revised from Zhang et al. (Citation2022), Pérez-Ruiz et al. (Citation2021), Thijs et al. (Citation2013), Pantawane et al. (Citation2020).
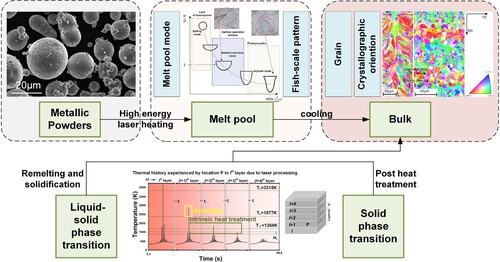
Figure 3. The computationally predicted thermal pattern in a single laser track. Reproduced from Pantawane et al. (Citation2020).
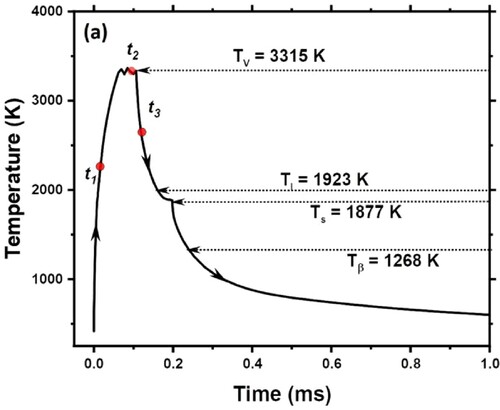
Figure 4. The computationally predicted thermal pattern of position P in a single layer. Reproduced from Pantawane et al. (Citation2020).
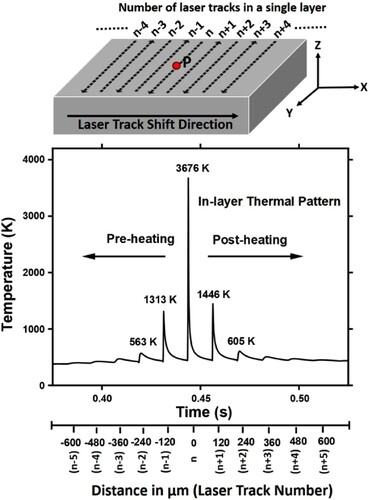
Figure 5. The computationally predicted overall thermal history of location P on the surface of lth layer in multiple layer fabrication. Reproduced from Pantawane et al. (Citation2020).
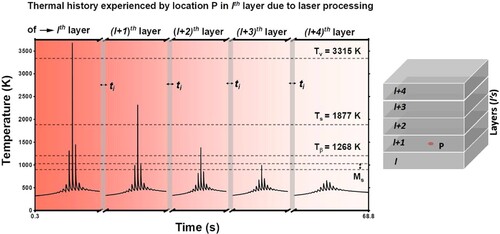
Figure 6. The influencing factors of thermal histories.
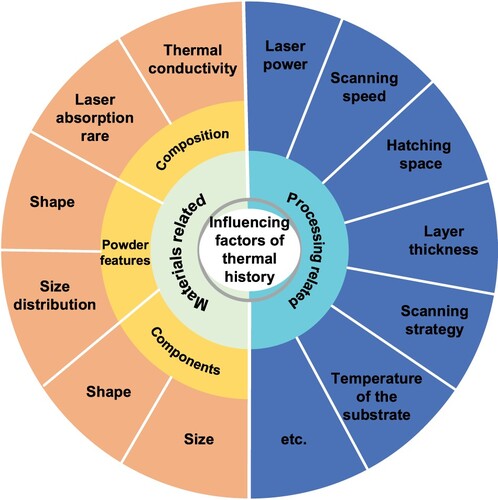
Figure 7. (a) The melt pool morphology varying with VED; (b) the illustrations of fish scale pattern in conduction and keyhole melt pool; (c) representative EBSD orientation maps of the front view (left) and top view (right) for an AlSi10Mg alloy LPBF part. Reproduced from Pérez-Ruiz et al. (Citation2021) (a and b) and Thijs et al. (Citation2013) (c).
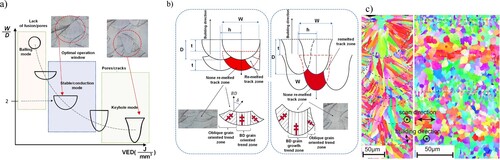
Figure 8. The grain structures at the centre plane in LPBF parts with different N0 with undercooling ΔTc being kept as 5 K. Reproduced from Li and Tan (Citation2018).
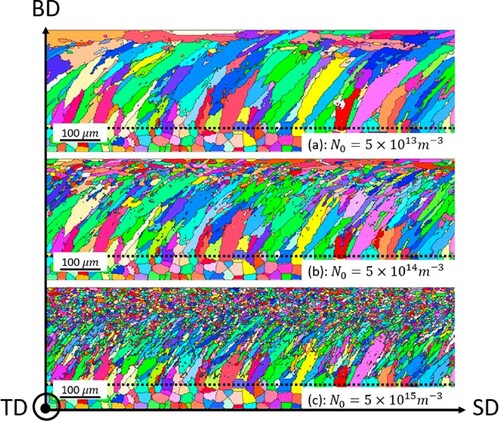
Figure 9. (a) Solidification map and (b) a representative G–V map. Reproduced from Van Cauwenbergh et al. (Citation2021) (a) and Li and Tan (Citation2018) (b).
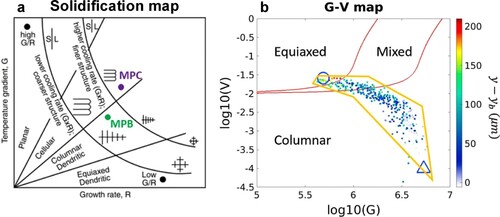
Figure 10. Interactions between LPBF parameters-microstructure-properties. Revised from Pérez-Ruiz et al. (Citation2021).
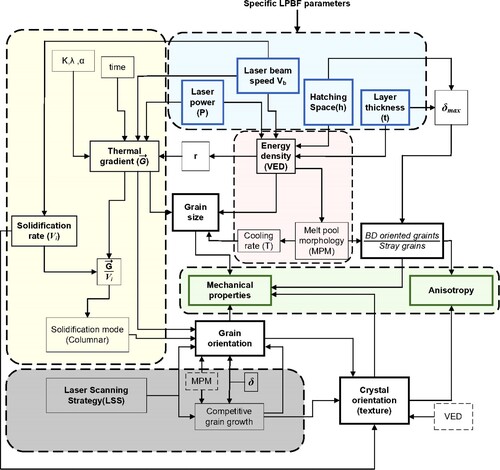
Figure 11. SEM images of etched top (−1) and side (−2) of Al–xSi LPBF samples fabricated with the optimal processing parameters. (a) Al–0Si, (b) Al–1Si, (c) Al–4Si, (d) Al–7Si, (e) Al–10Si, (f) Al–12Si, and (g) Al–20Si. Reproduced from Kimura et al. (Citation2017).
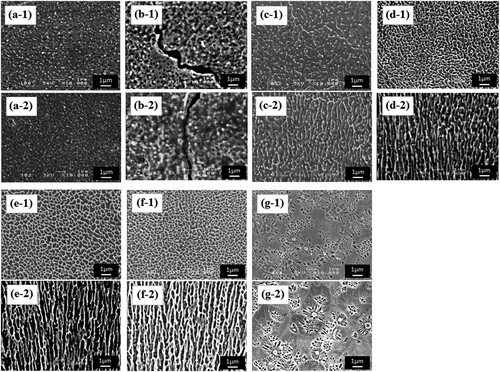
Figure 12. Microstructure of the as-built Al-5024 alloy fabricated by LPBF. (a) EBSD orientation map indicating the bimodal structure. (b) HAADF-STEM image of a fine equiaxed grain region with corresponding EDX elemental mapping. (c) Bright-field TEM image within a fine Al equiaxed grain region. (d) The selected area diffraction (SAD) from a single Al grain shown in (c), indicating single-phase Al in the [001] orientation. Reproduced from He et al. (Citation2021).
![Figure 12. Microstructure of the as-built Al-5024 alloy fabricated by LPBF. (a) EBSD orientation map indicating the bimodal structure. (b) HAADF-STEM image of a fine equiaxed grain region with corresponding EDX elemental mapping. (c) Bright-field TEM image within a fine Al equiaxed grain region. (d) The selected area diffraction (SAD) from a single Al grain shown in (c), indicating single-phase Al in the [001] orientation. Reproduced from He et al. (Citation2021).](/cms/asset/86b6395c-1987-4946-9ba3-1dc3472c6f76/nvpp_a_2125880_f0012_oc.jpg)
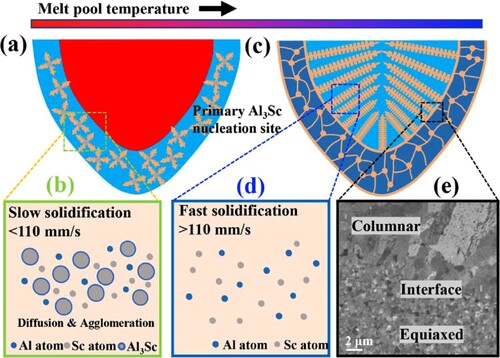
Figure 13. Schematic of early-stage and later-stage solidification within the melt pool, indicating how Sc atom distribution leads to a bimodal structure in the melt pool. Reproduced from He et al. (Citation2021).